|
|
Your Investments |
September 2019
|
|
|
Little has changed over the last month.
Escalating China trade tensions and an inverted bond yield curve continue to worry investors.
After dropping nearly 5% during August, the S&P 500 rallied late last week to finish the month down 1.58% on news of a potential pause in the implementation of new China/US tarrifs scheduled to go into effect on September 1. Unfortunately, the parties moved forward with tarriffs and the market is not happy, at least for today.
We've received several calls recently regarding the "inverted" yield curve asking what it is and what it means, so we will dive in below.
We will also revisit gold.
|
Canary in a Coal Mine?
If you've been watching the financial news you're probably asking yourself what is this "inversion of the yield curve" thing and should I be concerned?
An inverted yield curve marks a point on a chart where short-term investments in U.S. Treasury bonds pay more than long-term ones. When they flip, or invert, it's generally regarded as a bad sign for the economy.
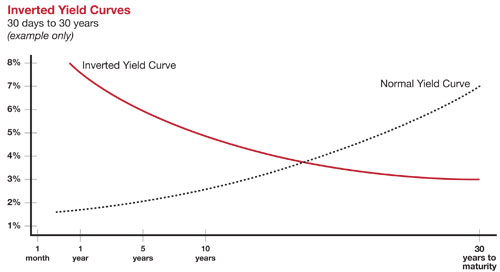
Economists use an inverted yield curve to predict economic slowdowns and recessions. While there have been false positive inversions, an inverted yield curve has correctly predicted all ten recessions since 1953.
Typically, the 10-year yield is compared to the two-year yield, and recessions usually occur 18-22 months after the inversion. Today, the US two-year treasury yield is 1.47%, while the ten-year is also 1.47%. Last week the ten-year was a little below the two-year.
One reason inversions happen is because investors are selling stocks and shifting their money to bonds. They've lost confidence in the economy and believe the meager returns that bonds promise might be better than potential losses they could incur by holding stocks into a recession. So demand for bonds goes up and the yields they pay go down.
But does this mean we're having a recession and a big downturn in the stock market? Not necessarily.
First, t
he curve may also have inverted because of the Federal Reserve. The market may be saying the Fed has kept the benchmark short-term rate it controls
too high
and that the central bank should cut rates further because the economy is slowing. Indeed, most inversions happen when the Fed is raising rates, not lowering them as it has done twice already this year.
The yield curve could also be distorted by more than $15 trillion worth of foreign bonds that pay negative interest rates.
Since the 2008 financial crisis, central banks around the globe have never been able to return interest rates to historically normal levels. They lowered interest rates to zero, and even below in some cases, to fight the Great Recession. This has driven foreign investment into to US bonds, further driving down their yields.
It is difficult to imagine a recession with corporate earnings on the rise, inflation below 2% and the Fed in a dovish mood.
In our view, the US economy will not experience a recession until inflation pressures force the Fed to start tightening again.
|
|
Precious Metals Continue to Rise
Two months ago, we wrote in our technical picture about gold breaking out of a multi-year basing formation as it climbed above $1,400. Today, gold is trading over 10% higher at $1,546. In that same span, silver is up more than 24% at $19 per ounce after having broken out of a long downtrend.
What is driving metals prices? Part of it is safe-haven demand. Part of it is summer cyclicality, as gold generally does well during June through the September Indian wedding season. However, we think something bigger is going on.
The Chinese central bank has added 94 tons of gold to its reserves over the last eight months. We conclude that China is protecting itself from its own currency manipulation as trade negotiations with the US continue.
Likewise, many other central banks are buying gold as countries race to the bottom in the currency wars to improve their trading position. Central banks bought more gold in 2018 than any year since 1967, and they are buying at an even faster pace in 2019.
Silver, which is more sensitive than gold to inflation expectations, has outpaced the yellow metal ever since it became clear that the Federal Reserve would cut rates in July. While inflation expectations are not currently high, increased tariffs may lead to some inflation. Meanwhile, the Fed has essentially given up on fighting inflation as it has entered an easing cycle.
Bottom line, while no investment goes straight up, as long as the trade war with China rages on and central banks cut rates while they stockpile gold, the precious metals are poised to climb.
|
In Closing
An inverted yield curve, like most other indicators, is not perfect and does not mean a recession is imminent. However, between that and the rising amount of low to negative-yielding debt in the world, strange things are happening with the bond market these days, and that's got investors on edge.
For us, as active managers focused on both growth and capital preservation, it's a reason for caution, and we have adjusted our portfolios accordingly.
"The four most dangerous words in investing are: 'This time it's different.'"
- John Templeton (1912-2008), British businessman and stock investor
Sincerely,
Marty Kerns
President & Chief Executive Officer
|
Parker Binion
Chief Investment Officer
|
|
|
About Kerns Capital Management
Kerns Capital Management is a leading asset management firm with a focus on quantitative, liquid alternative investment strategies, including the KCM Macro Trends Fund. We are value-oriented investors in long/short equity, credit and volatility, and apply the same attention to risk in the deployment of capital that has guided us since our inception as a fiduciary investment manager to corporate pensions, trusts and high net worth individuals. Kerns was founded in 1996, and is based in Houston, Texas.
|
|
IMPORTANT DISCLOSURES
Performance data represents past performance and is not a guarantee of future results.
Performance current to the most recent month-end may be lower or higher, and can be obtained by calling 800-945-2125.
The S&P TR 500 Index is an unmanaged composite of 500 common stocks. This index is widely used by professional investors as a performance benchmark. Total return includes reinvestment of dividends. You cannot invest directly in an index. The Dow Jones Industrial Average is a price-weighted average of 30 of the largest and most widely held stocks traded on the New York Stock Exchange and the Nasdaq. The Nasdaq Composite Index is a market-capitalization weighted index of the more than 3,000 common equities listed on the Nasdaq stock exchange. The types of securities in the index include American depository receipts, common stocks, real estate investment trusts (REITs) and tracking stocks.
|
|
|
|
|