Lantern Wealth Advisors, LLC
35 Pinelawn Road
Suite 101E
Melville, NY 11747
(631) 454-2000
[email protected]
https://lanternwa.com/


Major Indexes For Week Ended 10/12/2018

Index Close Net Change % Change YTD YTD %
DJIA 25,339.99 -1,107.06 -4.19 +620.77 2.51
NASDAQ 7,496.89 -291.56 -3.74 +593.50 8.60
S&P500 2,767.13 -118.44 -4.10 +93.52 3.50
Russell 2000 1,546.68 -85.43 -5.23 +11.17 0.73
International 1,850.75 -76.39 -3.96 -200.04 -9.75
10-year bond 3.14% -0.08% +0.73%
30-year T-bond 3.32% -0.08% +0.58%
International index is MSCI EAFE index. Bond data reflect net change in yield, not price. Indices are unmanaged and you cannot directly invest in an index.


Analyzing The Risk Of Stocks After The 6.9% Drop

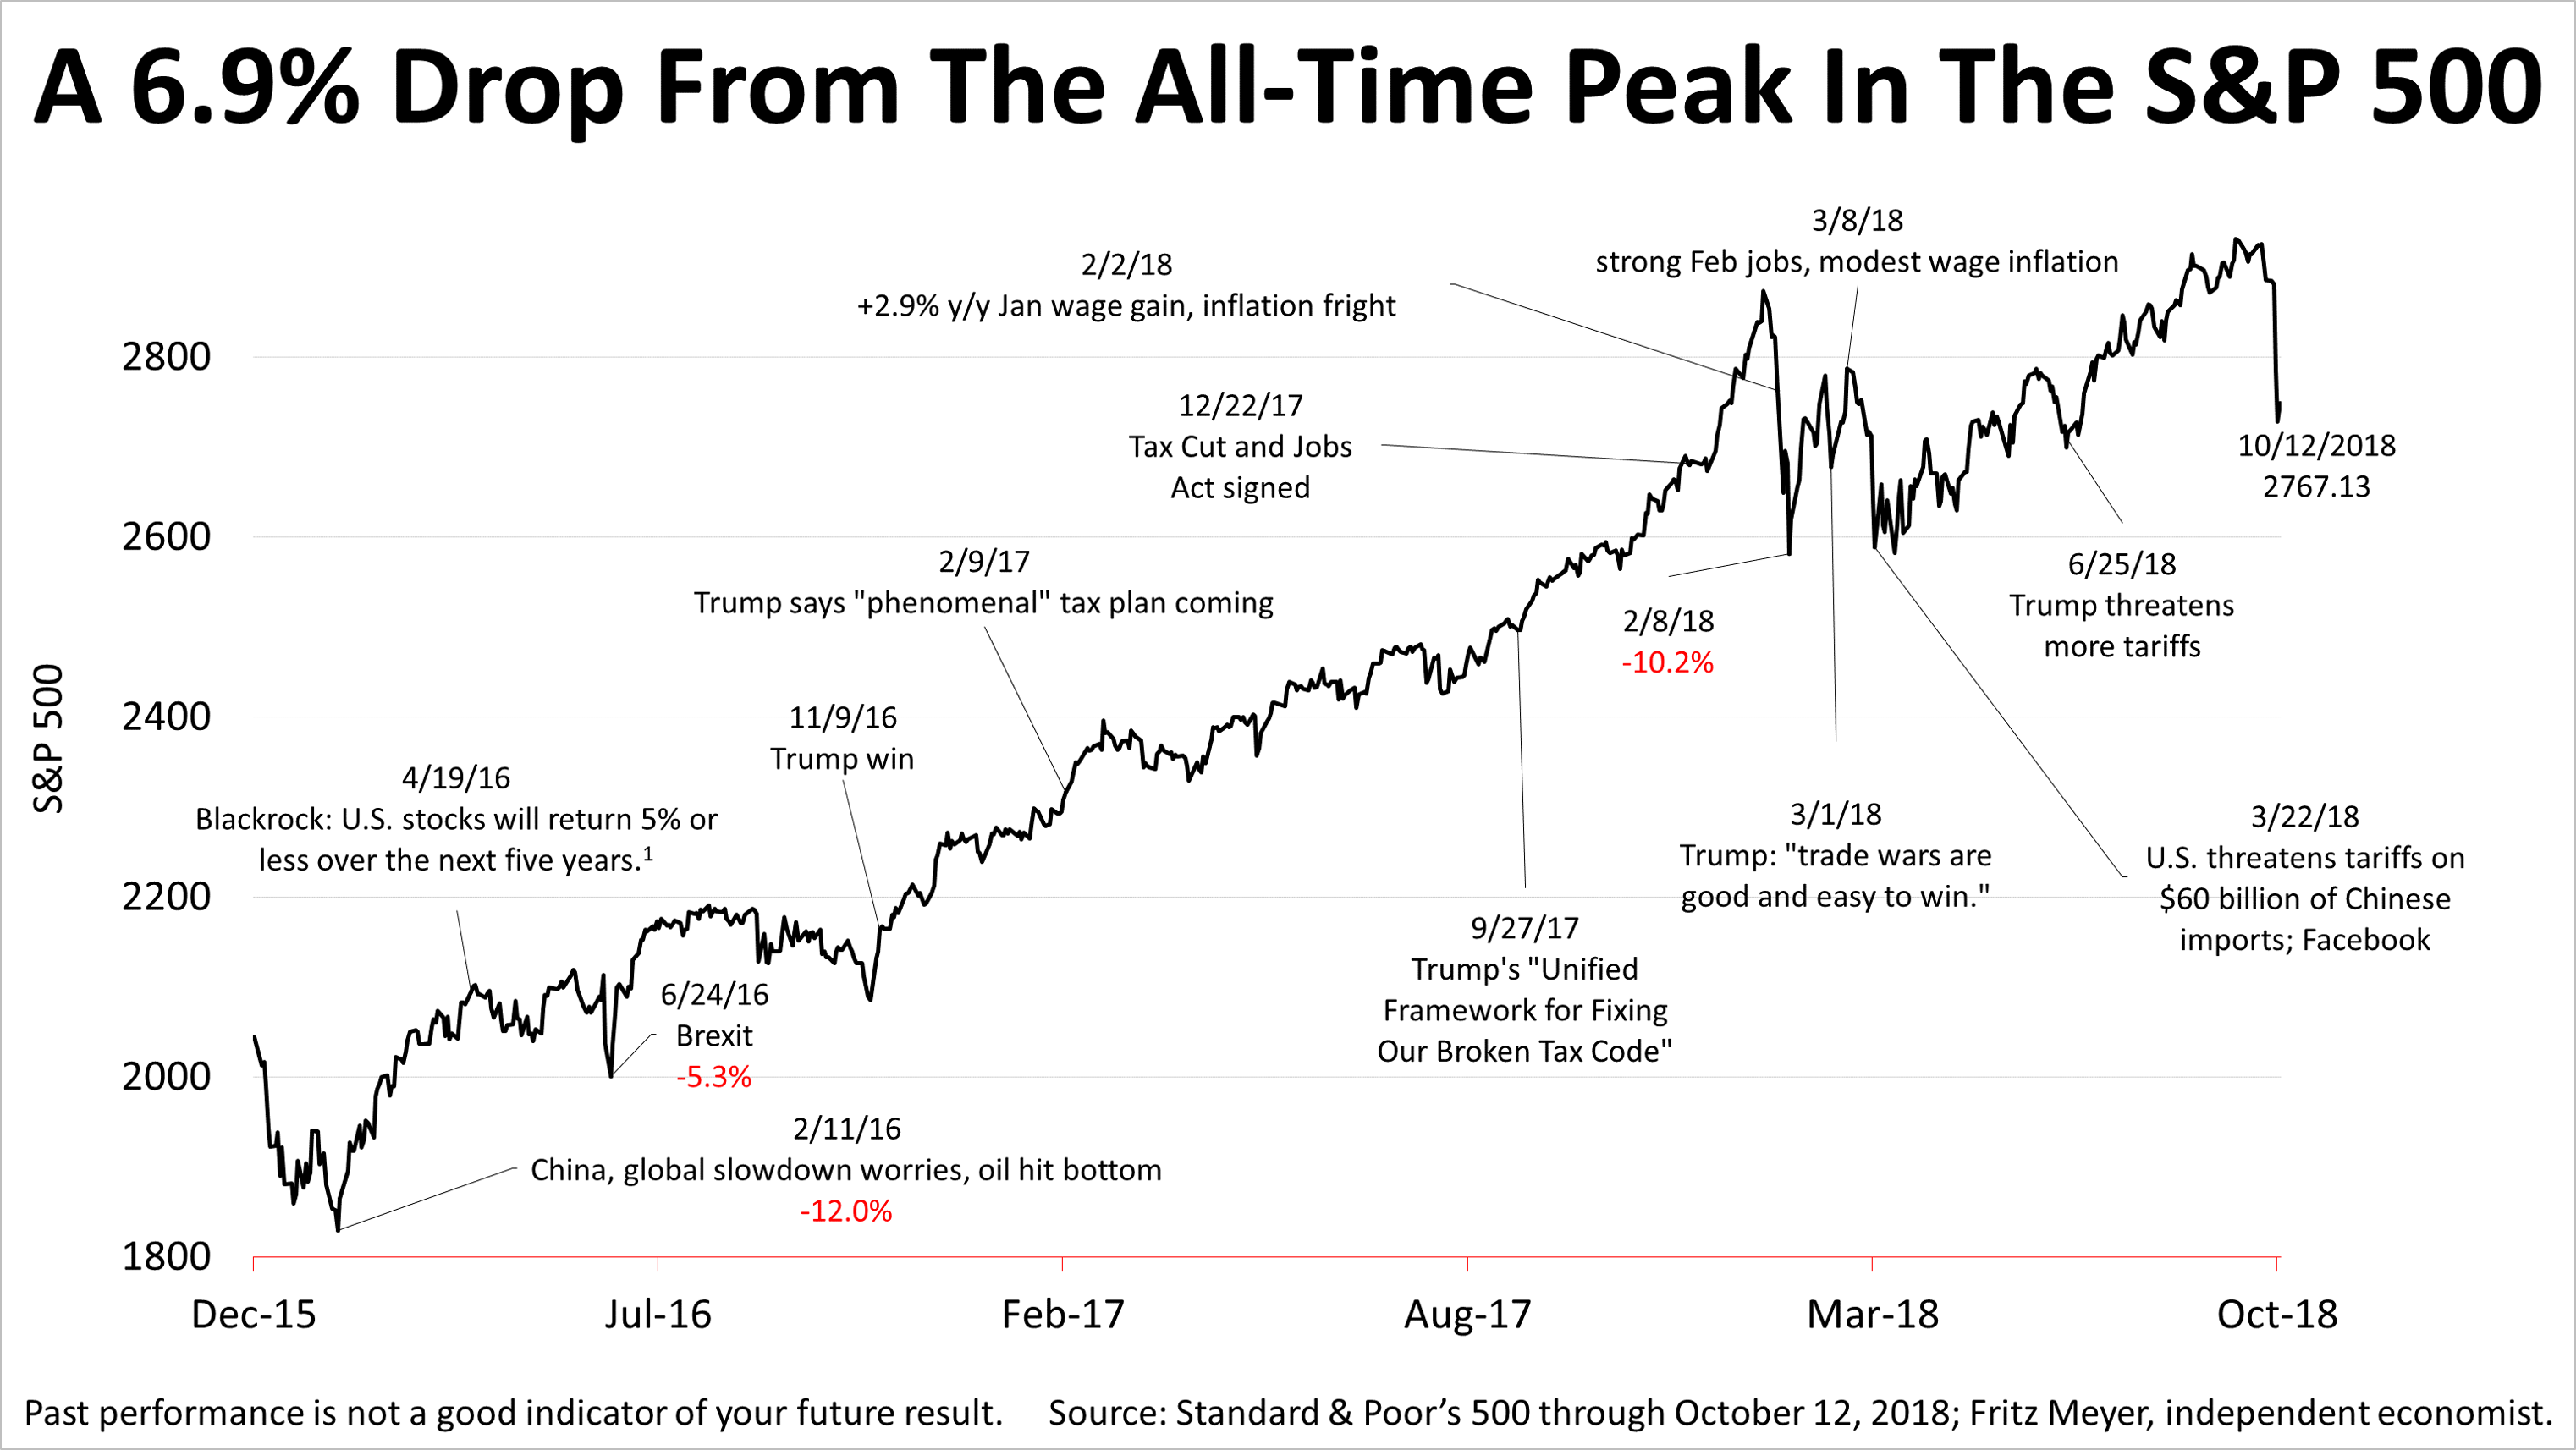
The stock market snapped a six-day losing streak on Friday, with the Standard & Poor's 500 closing at 2767.13.

From its peak all-time close on September 20, to its closing low on Thursday, the S&P 500 plunged 6.9% in the six-day drop.

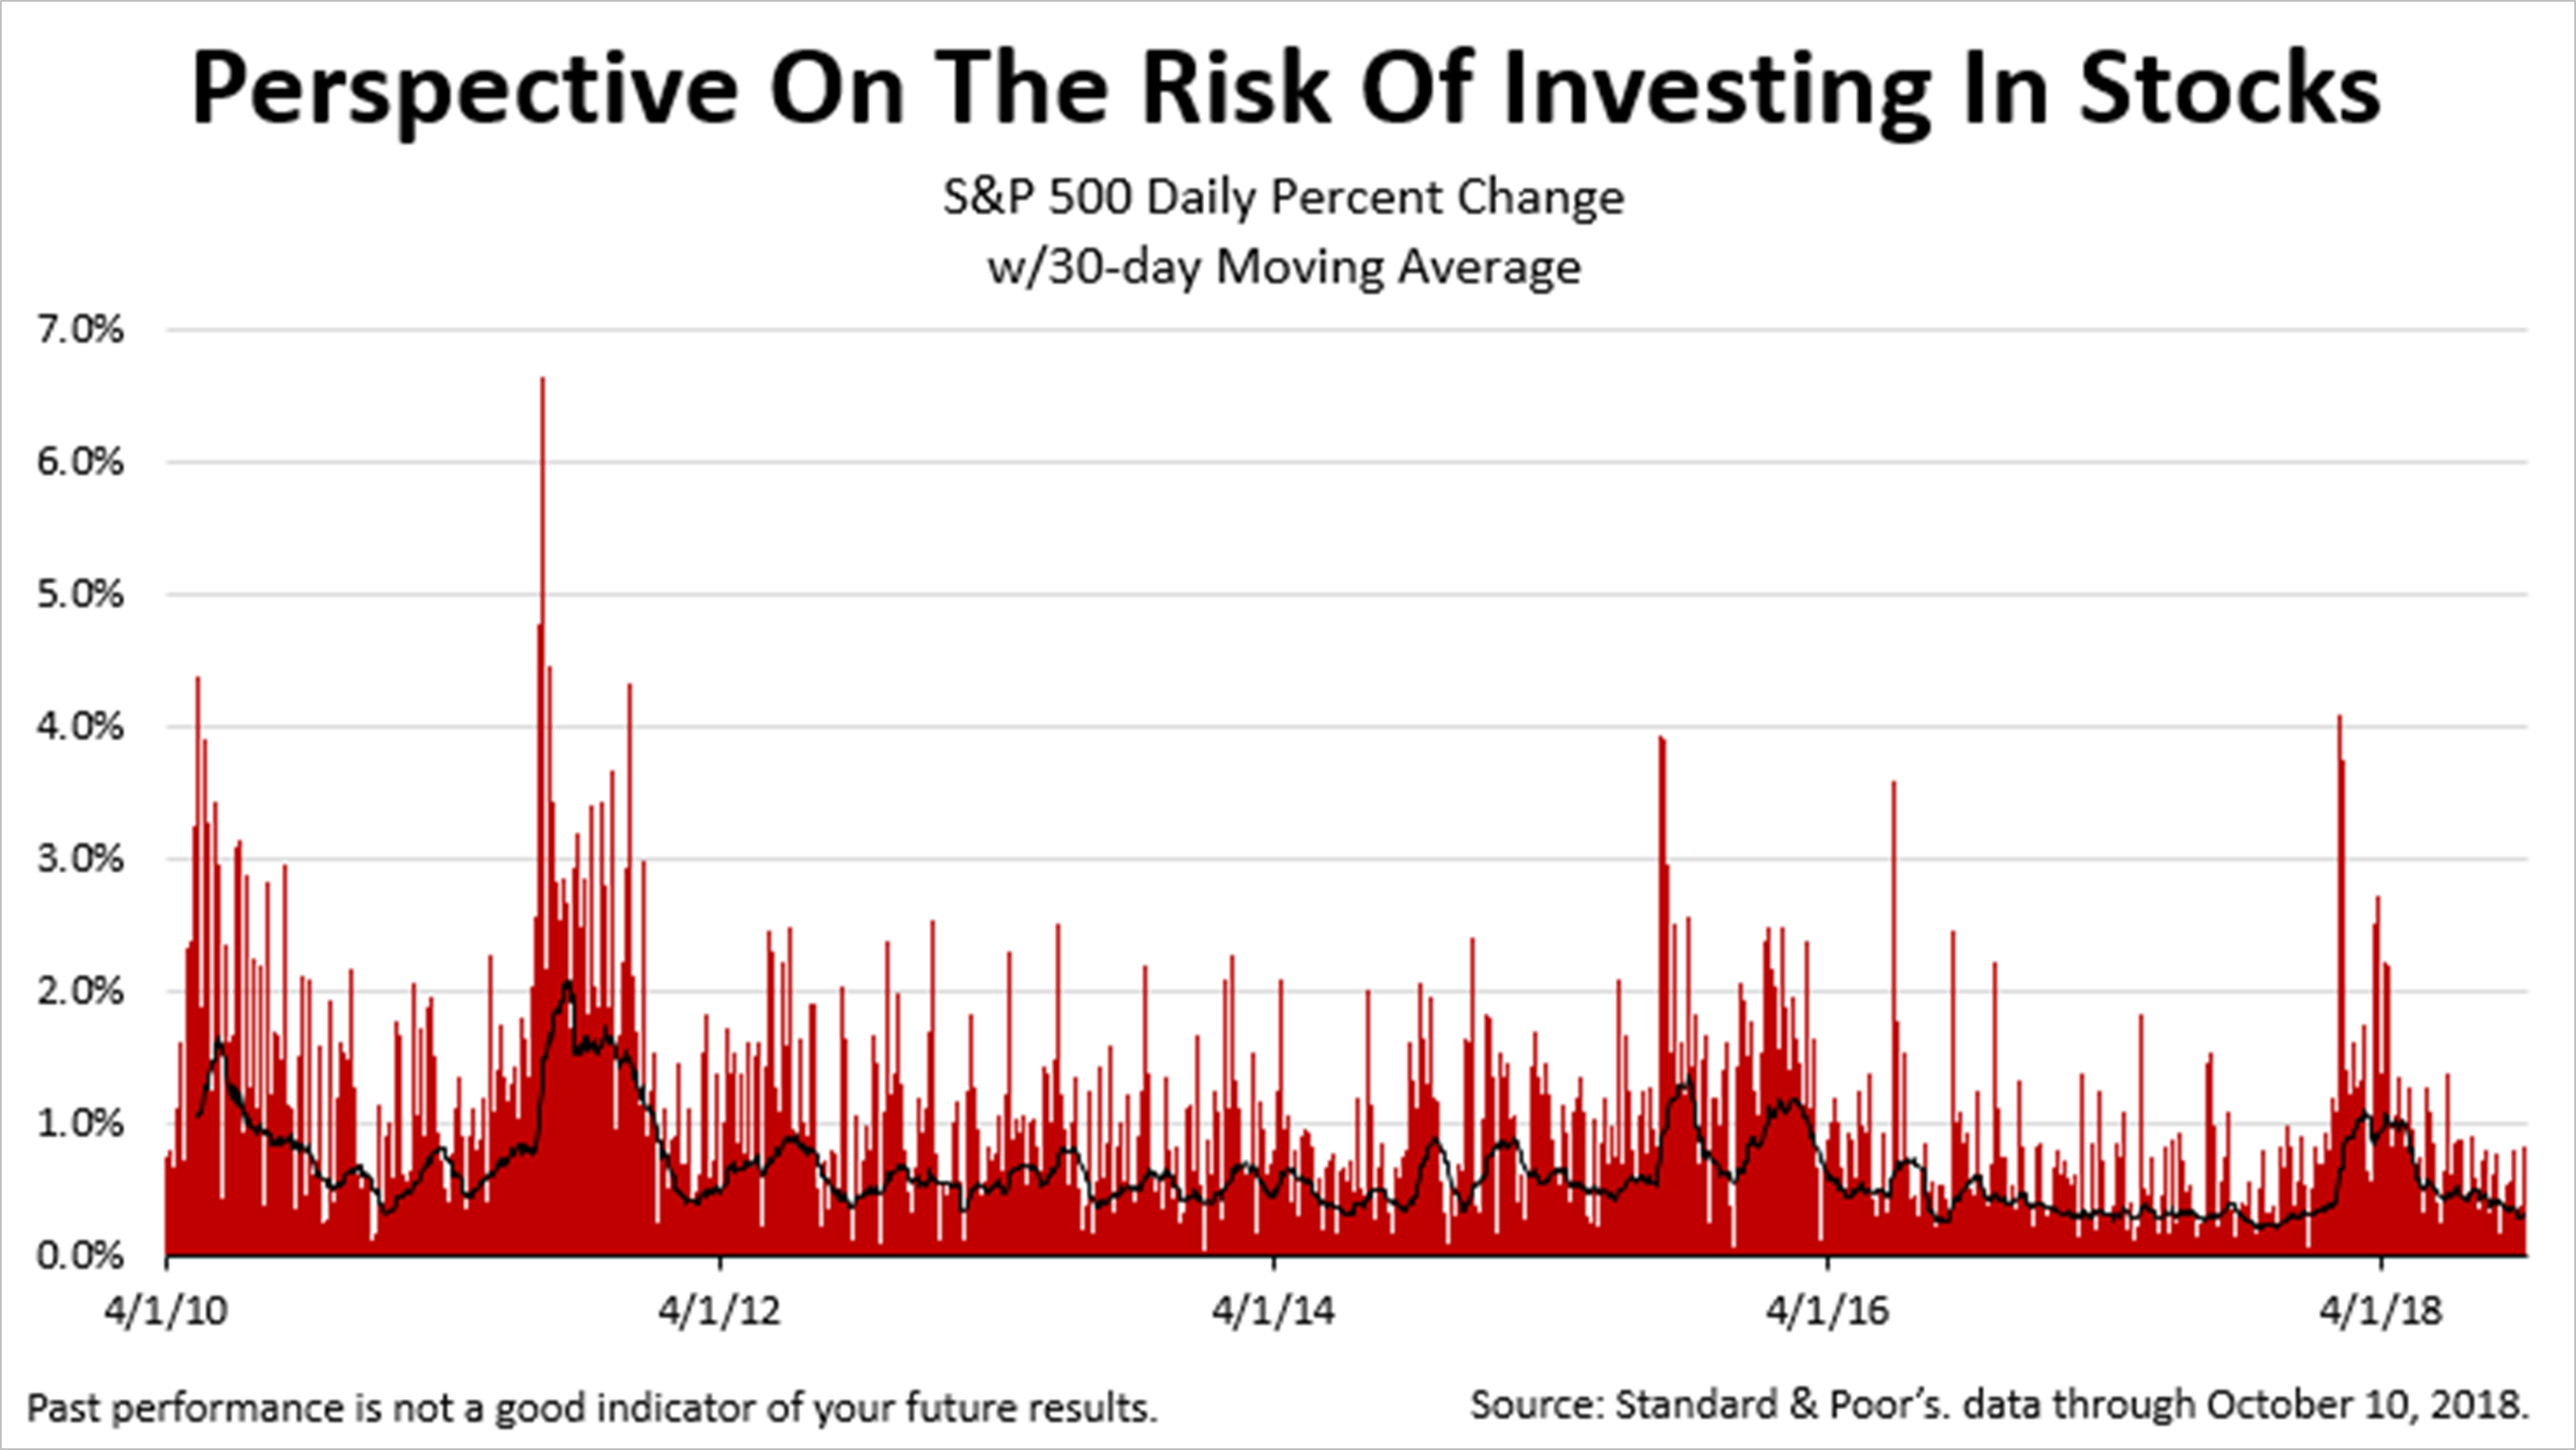
The volatility in recent days is not so frightening in the context of the last eight-plus years, this chart indicates. The red lines represent the daily percentage change in the average price of a share in the S&P 500 since April 2010, and the black line is the 30-day moving average of the S&P 500 share price.

Price volatility is a key way of measuring the risk of owning stocks, especially since the most volatile days are losing days. While one-day spikes are frightening losses, the 30-day average price moves along much more smoothly. Trouble is, when you are in the middle of a red-line period, it's hard to focus on the black line. It's often hard to believe that prices historically smooth over, over longer periods and there is a good chance of that happening again.

In fact, this is why investors get paid a premium for the risk of owning stocks versus other less volatile alternatives. Over the decades, stocks historically returned about 10% annually. Nothing ever is guaranteed in investing but that's about 6% more annually than the return on a 30-day U.S. Treasury-backed fixed income investment. That equity risk premium was awarded to investors for putting up with the volatility of stocks.

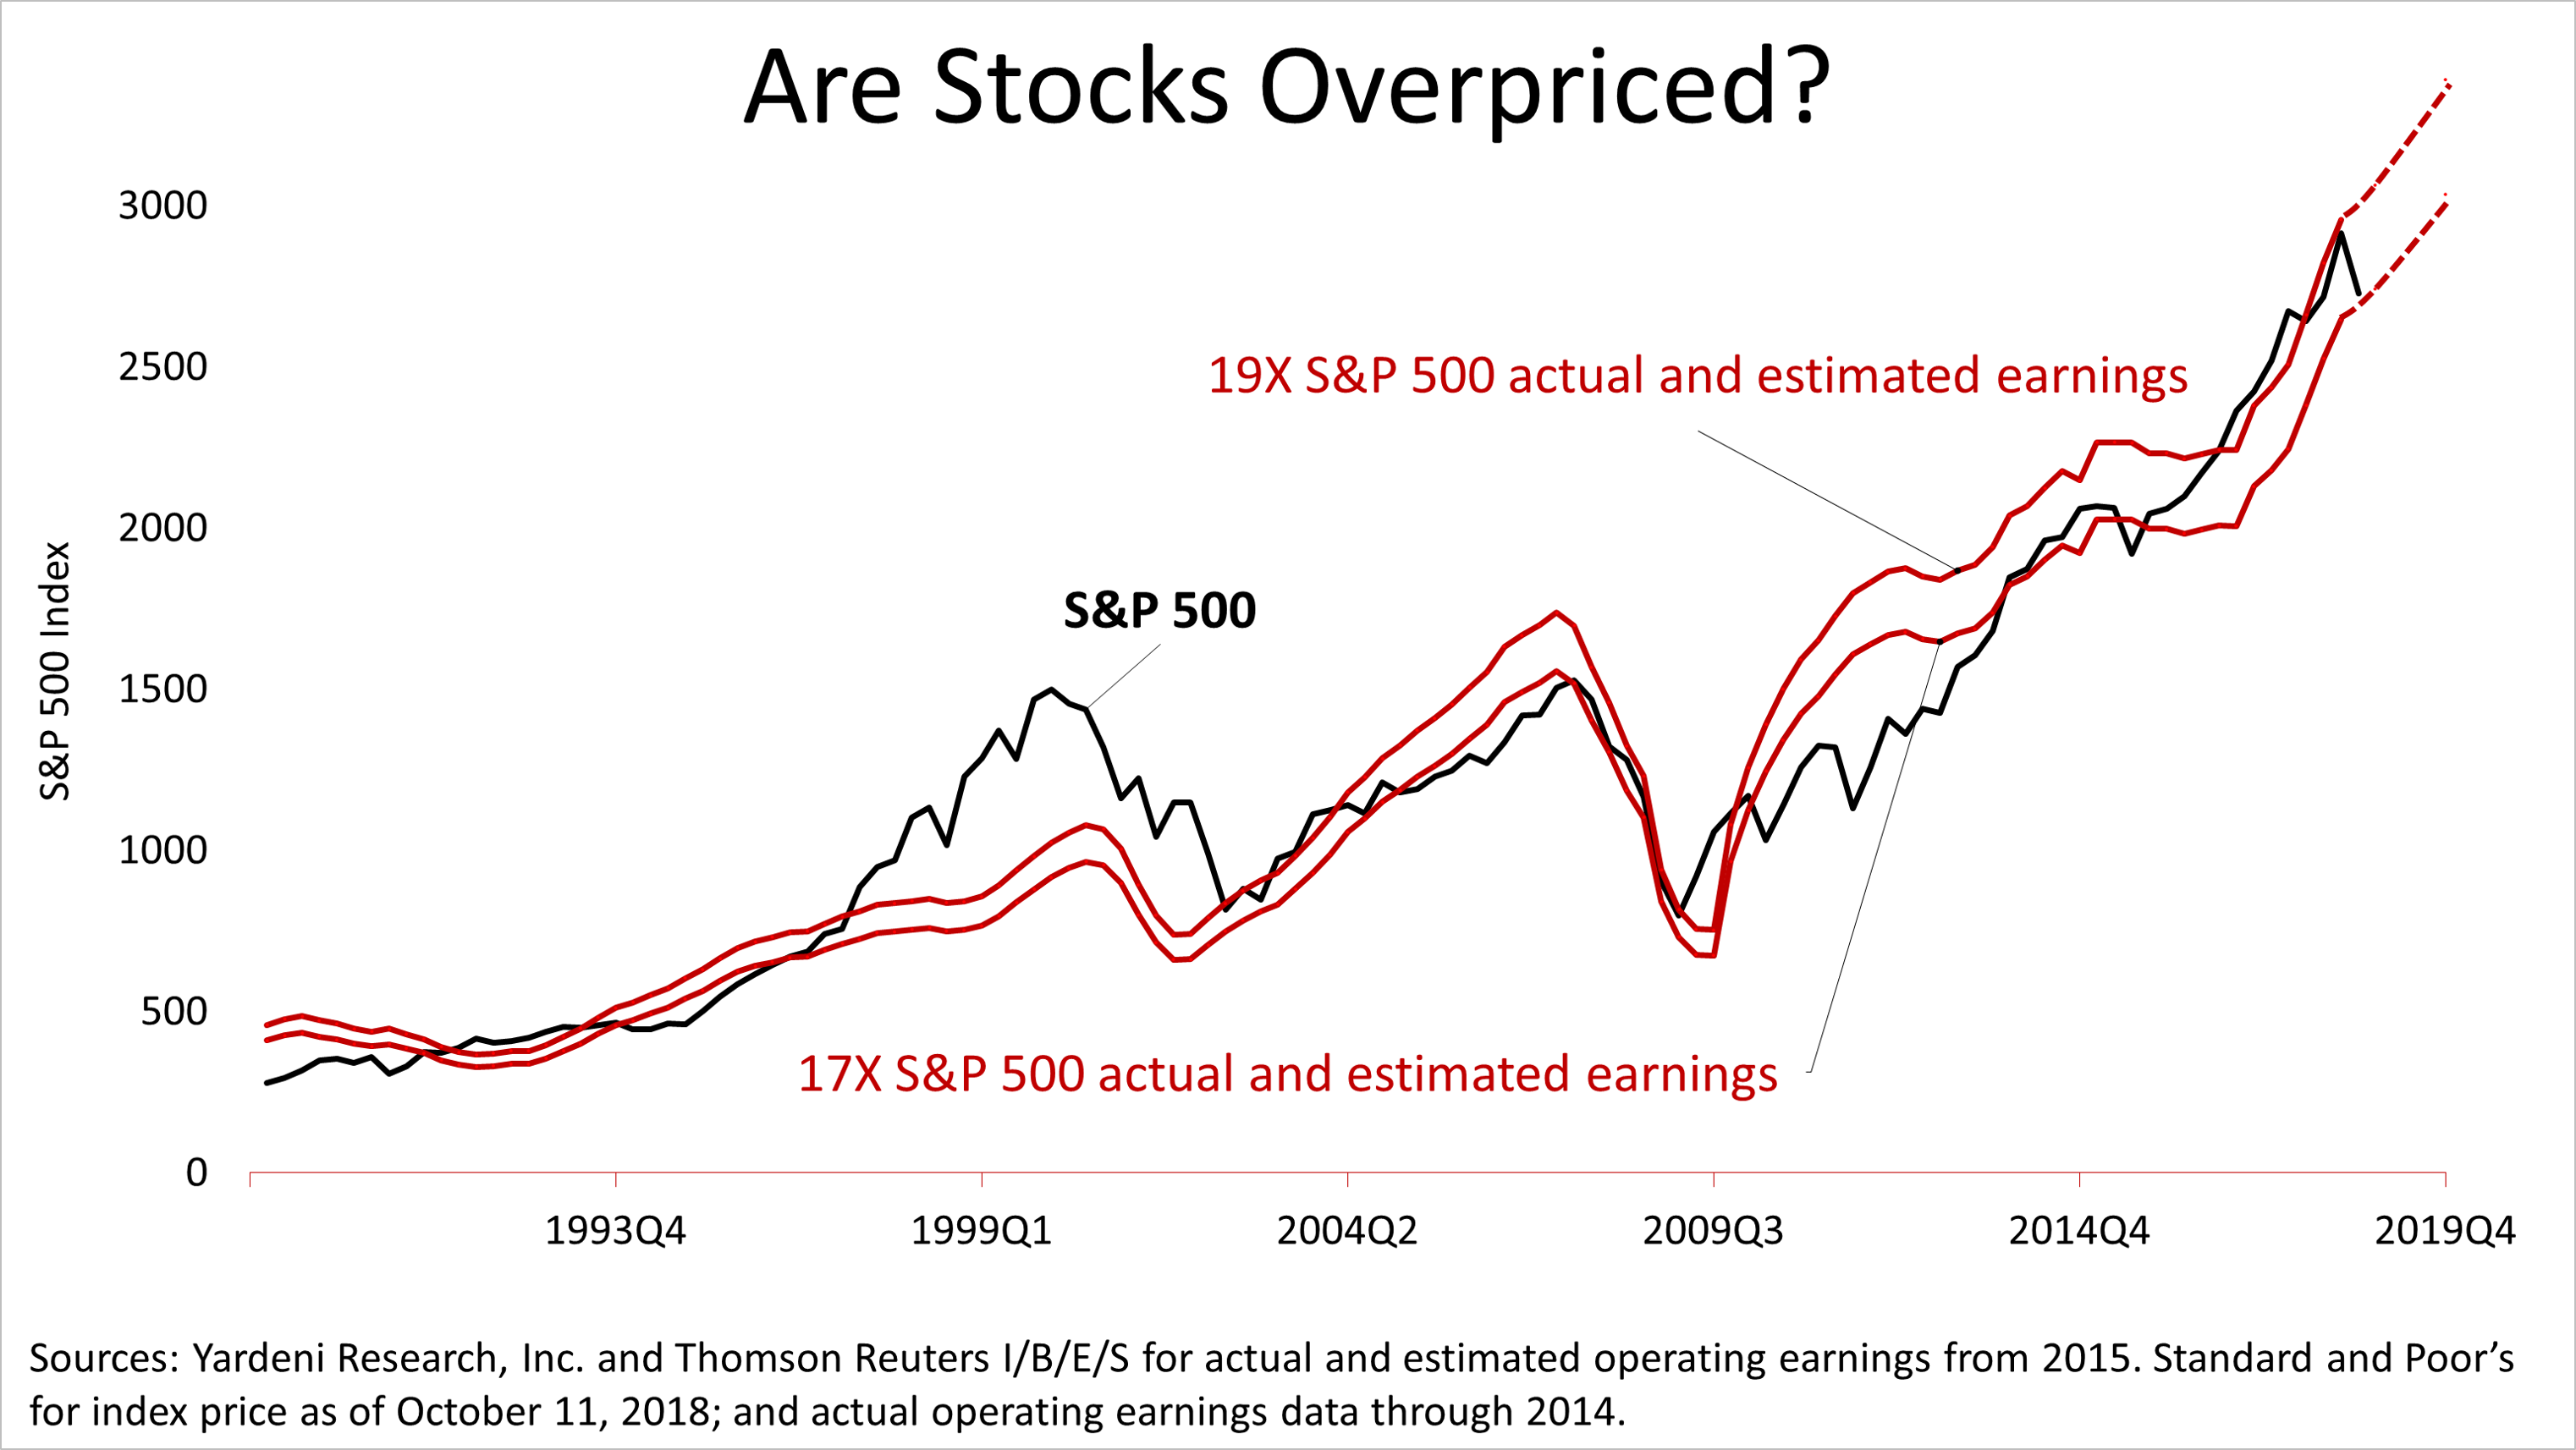
If the recent volatility unnerved you, keep the following lesson in mind: Corporate profits have always driven the value of share prices in the S&P 500 stock prices in the long run, and this chart shows current as well as expected profits, which indicate stock prices are not unreasonable compared to their history.

The black line shows the price of the S&P 500 index since 1990, while solid red lines represent the upper and lower bands of valuations placed on stocks. If a share in the S&P 500 was priced at 17 times 12-month trailing profits, the lower red price line would have resulted, while a price-to-earnings multiple of 19 would have created the upper red line. The dotted lines represent forecasts by Wall Street analysts for earnings at the same price-to-earnings multiples. This indicates share prices are at the lower end of their historical valuation range following the recent drop of 6.9%.


1Investment News, April 19, 2016, by John Waggoner.

2017, 2018 (estimated) and 2019 (estimated) bottom-up S&P 500 operating earnings per share as of October 1, 2018: for 2017, $131.98; for 2018(e), $161.19; for 2019(e), $178.43. Sources: Yardeni Research, Inc. and Thomson Reuters I/B/E/S for actual and estimated operating earnings from 2015. Standard and Poor's for index price data as of October 11, 2018; and actual operating earnings data through 2014.

This article was written by a veteran financial journalist based on data compiled and analyzed by independent economist, Fritz Meyer. While these are sources we believe to be reliable, the information is not intended to be used as financial advice without consulting a professional about your personal situation. Indices are unmanaged and not available for direct investment. Investments with higher return potential carry greater risk for loss. Past performance is not an indicator of your future results.

When To Disclaim An Inherited IRA

Should you ever pass up a chance to get more money? It depends. Suppose you're in line to inherit IRA assets. When it makes sense, you might use a "qualified disclaimer" so that the assets bypass you on the way to someone else.

A disclaimer is a legal document that lets you waive your right to receive money or property from an estate. If you execute a disclaimer, it's as if you never inherited the assets. Instead, they go directly to the next people in line to receive them. In the case of an IRA, the assets typically wind up with the account's contingent beneficiaries.

Why would you do this? There are two main reasons:

1. Assuming you don't need the money, you might prefer that the assets go directly to the younger generation, usually your own kids or grandkids. You were going to give the assets to them eventually anyway, right? A disclaimer shortens the process while lengthening the time over which the beneficiaries must take required minimum distributions (RMDs) from the account. RMDs are based on the life expectancies of the beneficiaries, so the younger they are, the longer the wealth can be preserved.

2. A disclaimer may reduce a family's overall tax liability. The RMDs from IRAs generally are taxed at ordinary income rates, which go as high as 39.6%. Younger children and grandchildren are likely to pay tax at a much lower rate.

For a disclaimer to work, it has to be an irrevocable, unqualified refusal to accept property, and it must meet the following requirements:

  • It must be in writing with a declaration and signature of the person who is making the disclaimer.
  • It must identify the property (or the partial interest in the property) that is being disclaimed.
  • It must be delivered to the party or entity responsible for transferring the assets (for example, an IRA custodian or trustee).
  • The disclaimer has to be executed less than nine months after the property was transferred (or within nine months of when the disclaiming person reaches age 21, if that's sooner).
  • As a result of the disclaimer, the assets must pass to the new recipients without any direction from the person making the disclaimer. You can't decide to give the money to someone other than the legal beneficiaries next in line.

This process can be technically complicated, so you'll need to work with an attorney to provide the proper language for a disclaimer, which must take into account whatever is required under state law. Also, take great care in completing any beneficiary designation forms furnished by an institution.


The above referenced information was obtained from reliable sources, however Lantern Investments, Inc. and Lantern Wealth Advisors, LLC cannot guarantee its accuracy. Opinions expressed herein are subject to change. Past performance is no guarantee of future results. Asset allocation and diversification do not assure a profit or protect against losses in declining markets. Any information given on the site is informational and illustrative but does not recommend actions as the information may not be appropriate to all situations. It is important that you consider your tolerance for risk and investment goals when making investment decisions. Investing in securities does involve risk and the potential of losing money. Links to other sites are provided for your convenience. Lantern Wealth Advisors, LLC and Lantern Investments, Inc. do not endorse, verify or attest to the accuracy of the content of the web sites that are linked and accept no responsibility for their use or content. Lantern Wealth Advisors, LLC and Lantern Investments, Inc. do not provide tax, accounting or legal advice.