Here at the National Coordinating Office we've been buzzing along, working to release new products and reports to help you find phenology data that meets your research and application needs! Read below to learn more about a recent report that describes our suite of observational data products, and new maps that show annual anomalies for leaf and bloom indices from 1981 to the present.
We are also increasing our efforts to learn more about the needs of broader communities of stakeholders to enhance our ability to assist you in decision-making. We hope these efforts will result in greater collaboration and locally-relevant products. Please reach out if you have ideas to elevate communication and engagement between the USA National Phenology Network and your organization or community of practitioners.
Happy Spring!
|
|
What's new at the USA National Phenology Network
|
|

2017 Annual report
In 2017, observers submitted a record 2.9 million records to the National Phenology Database, the Network released 25 data products, and 11 scientific papers were published using USA-NPN data and products.
Read about these and many more accomplishments and highlights in the 2017 USA-NPN annual report. None of this would be possible without you!
Download 2017 Annual Report »
|

Pheno forecast effort to expand with grant
The USA-NPN was recently awarded a USGS Community for Data Integration grant to deliver workflows and tools to predict the timing of invasive species activity. This project will build upon existing efforts to deliver 6 day forecasts of insect pest species, to improve and develop products that aid in decision-making by natural resource managers.
Read more »
|

Gulf Coast Phenology Trail
Did you know there are many regional phenology efforts collecting high quality data? These efforts are coordinated across groups and sites so that there is frequent data collection on a carefully selected group of taxa. These datasets can be highly valuable to include in your analyses, as they are designed with rigorous scientific questions in mind.
Download Report »
|
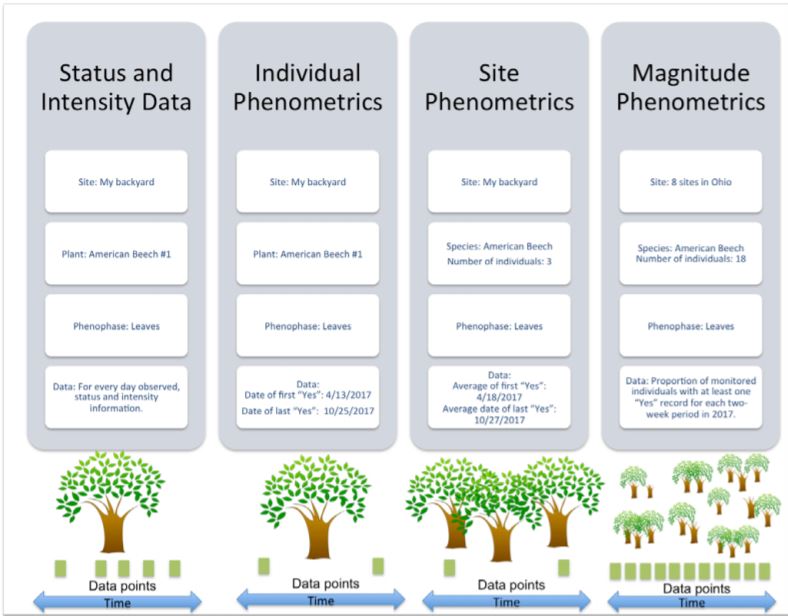
USA-NPN observational data report
A USGS Open File Report that documents the USA-NPN observational data is now published and available for
download. This report details the four data types available from the
Phenology Observation Portal and via web services. You can also learn more in this report about the measures taken to ensure high
data quality in these data types.
|
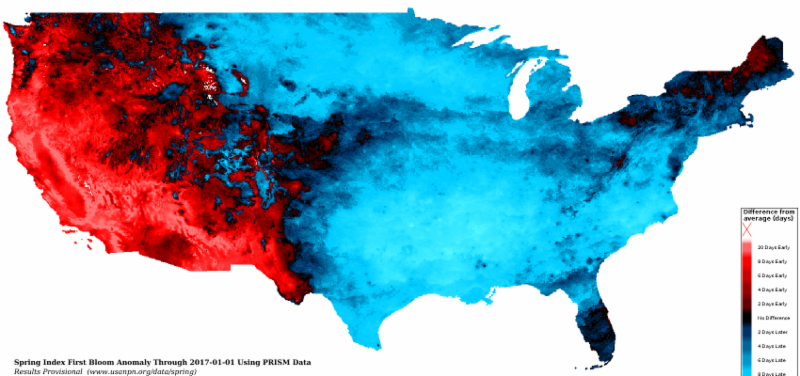
Annual Spring Index anomaly maps
Historical annual leaf and bloom index anomaly maps are now available! These maps compare each years
Spring Index leaf and bloom dates with the
30-year average (1981-2010). You can use these to better understand how anomalously early or late any location in a given year, from 1981 to the present, was across the United States.
|
|

Phenology ontology framework
A new paper in
Frontiers in Plant Science describes the framework for a Plant Phenology Ontology. Stuckey and colleagues developed a standardized vocabulary that allows for data integration across heterogenous phenology datasets. This article used the data model to generate a global dataset from
NEON,
USA-NPN, and
PEP725.
|
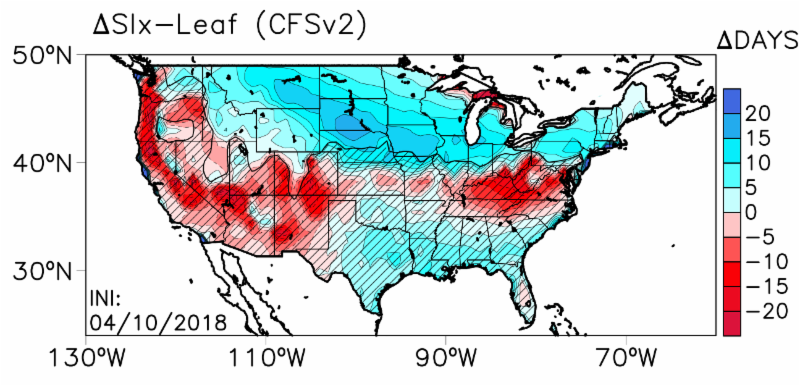
Intra-seasonal spring forecasts
In the
Journal of Geophysical Research, Carrillo and colleagues used output from the North American Multi-Model Ensemble to asses the predictability of the
Spring Index models. The authors found that useful predictions of the start of spring could be generated for anywhere
from 10 to 60 days in advance, depending on the threshold for variability.
|
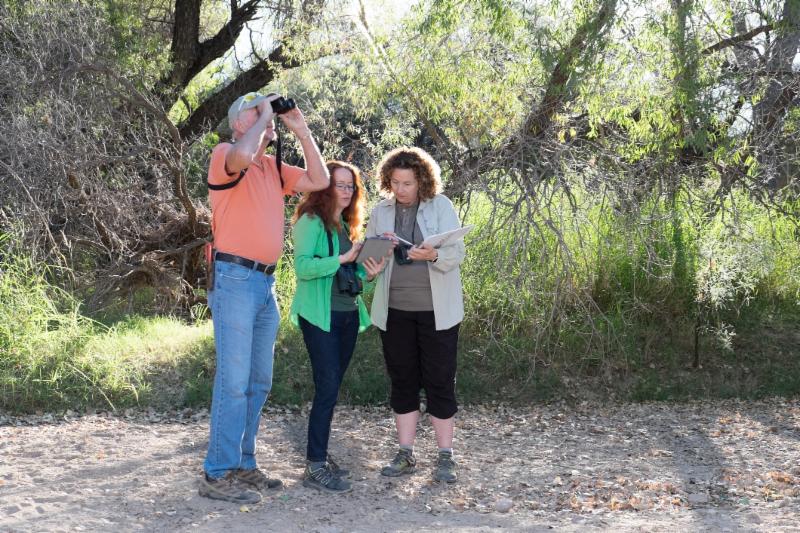
Training citizen scientists impacts accuracy and precision
In a new paper in the
International Journal of Biometeorology, Feldman and colleagues describe how the extent of training received by citizen scientists using the USA-NPN protocols in Acadia National Park impacts the quality of phenological observations. The researchers found that trained observers were more likely to be biased
based on prior observations, leading to precise but sometimes
inaccurate measurements compared to experts and untrained observers.
They advocate for more frequent training throughout the season.
|
|
|
|
|