Key Facts About Tariffs, Interest Rates, And Economic Strength
Tariffs, interest rates, and the economy's strength are triggering fear and market volatility. Here are the facts.
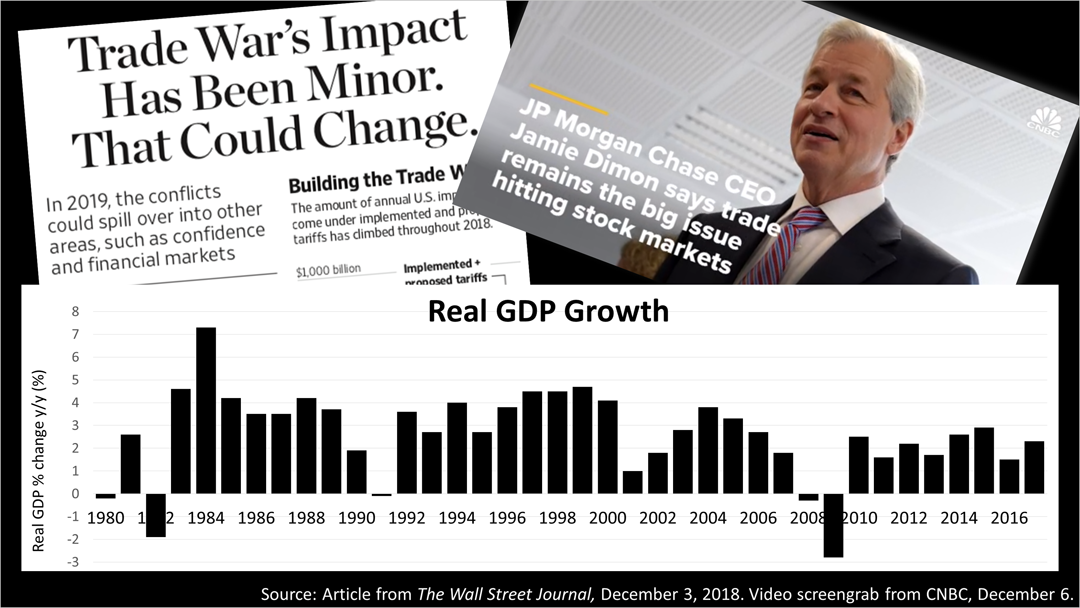
Fears of a trade war with China are all over financial cable TV news and even The Wall Street Journal headlines are sounding an alarm, implying it could become a major problem. But the facts indicate such fear is overdone.
In an October 8th column on this topic, Bob Davis in the WSJ quoted from a study by JP Morgan concluding that tariffs would reduce U.S. output growth by just one-tenth of 1% in 2018 and three-tenths of 1% in 2019. Assuming the worst fears about a trade war with China would be realized, resulting in a $125 billion tariff on $500 billion of imports on Chinese goods, the impact on the $20 trillion U.S. gross domestic product was miniscule.
In 1984, President Reagan imposed trade barriers on autos and steel, which amounted to 21% of total U.S. imports, and it was nonetheless a great year of U.S. economic growth.
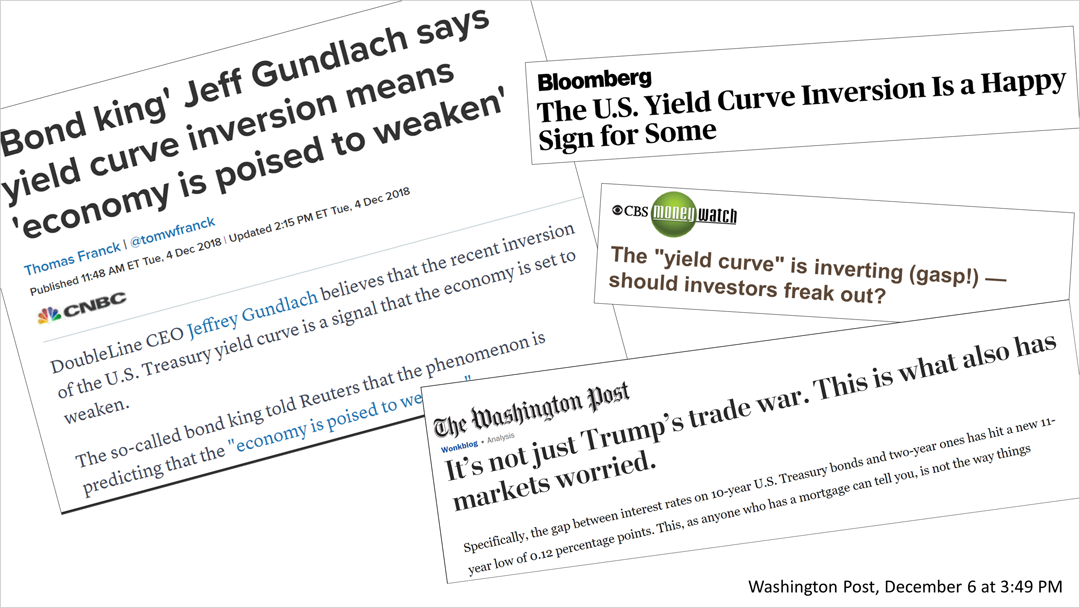
Similarly, fears about Fed policy on interest rates made for sensational headlines all week long, with major media outlets throughout the nation saying the yield had inverted and a recession was on the horizon.
The facts are not that bad! The media generally seem eager to report bad news and moribund stories about fed policy causing an inversion of the yield curve are focused on the wrong yield curve. They're reporting on the differential between the U.S. Treasury 10 year-bond and the U.S. Treasury two-year note. That's the wrong yield curve to watch if you're trying to predict a recession. The yield curve differential that really matters is the 10-year Treasury versus the rate on the 30-day Treasury, the Fed funds rate!
The San Francisco District of the Federal Reserve, the central bankers that regulate interest rate policy, on August 27, 2018, in an Economic Letter, said "the most useful interest rate term spread for forecasting recessions is the 30-day Treasury Bill versus the 10-year Treasury."
The difference between the 30-day and 10-year Treasury currently is 0.92%. The last time this yield curve narrowed to this level, the expansion continued for another three years. In the runup to the recession of 2001, the 30-day/10-year Treasury yield curve fell to 0.92% five years before the expansion ended and the economy entered a recession.
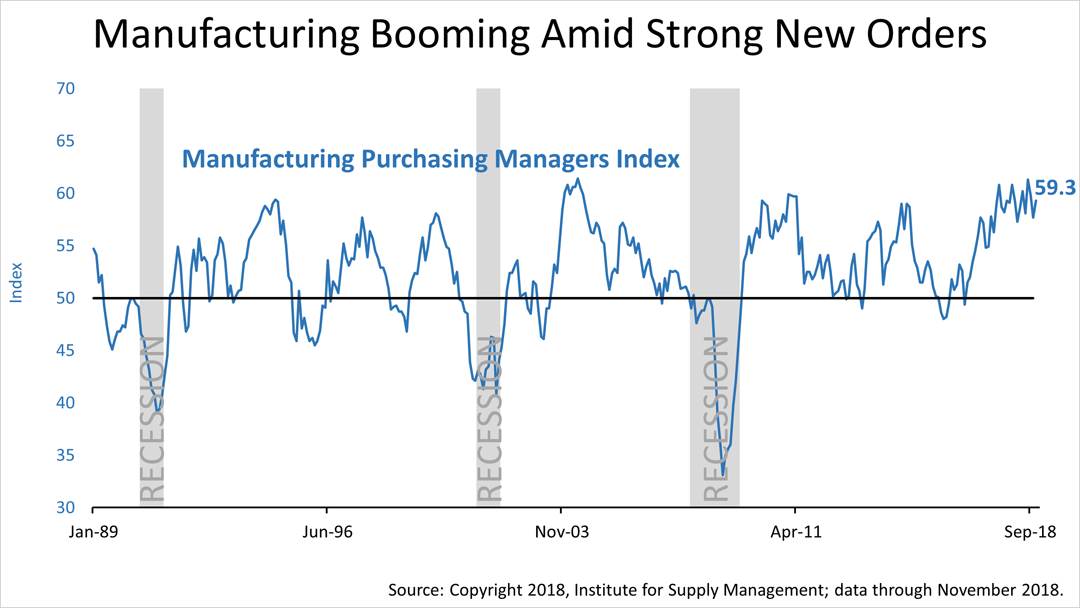
November's manufacturing purchasing managers survey, released Monday, showed an uptick to 59.3, from October's 57.7.
The new order's subcomponent jumped from October's 57.4 to 62.1. This is a forward-looking measure of manufacturing activity. By all measure, manufacturing is booming.
Before previous recessions, the Institute of Supply of Management's manufacturing index has definitively slumped to a reading under 50 before the economy slid into a recession.
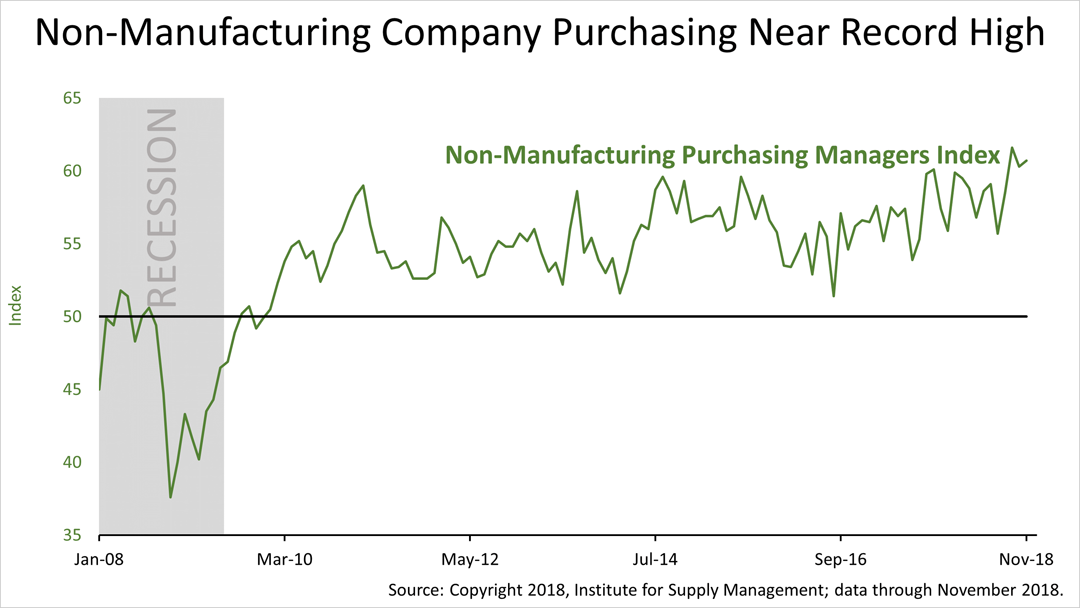
The ISM non-manufacturing index in November hit 60.7, ticking up from October's 60.3, and off only slightly from September's record 61.6.
November's new orders sub-index, while not shown here, rose to 62.5 from October's 61.5, and higher than September's blowout 61.6.
Non-manufacturing accounts for about 86% of U.S. economic activity, making this index an important barometer of economic strength.
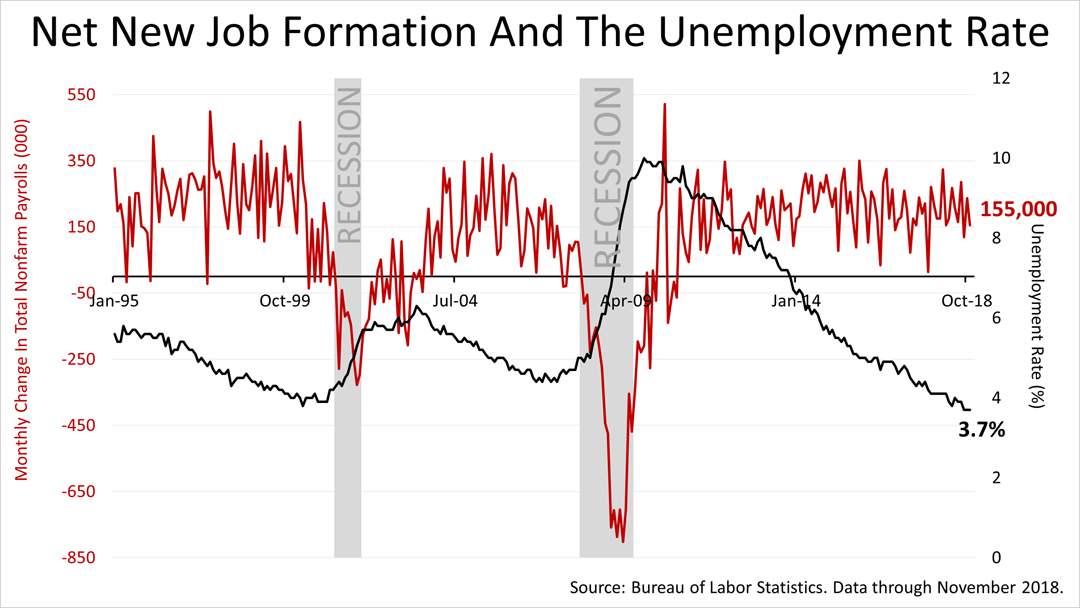
New job formation was slightly lower than expected on Friday but remained at a strong level. Unemployment stayed near a record low.
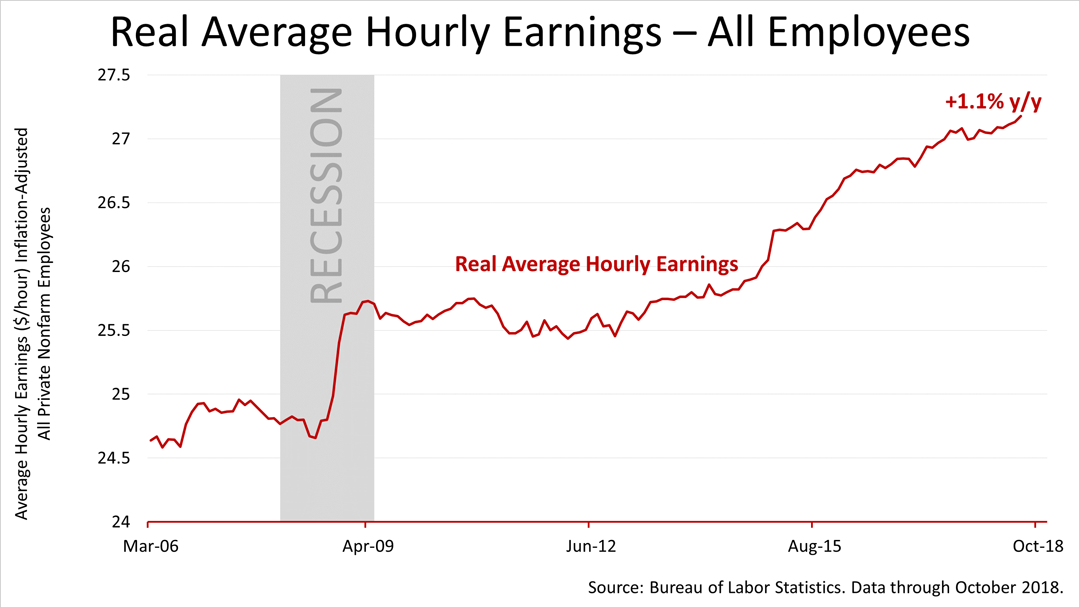
Real average hourly earnings grew by 1.1% in the 12 months through October, following September's 0.8% 12-month real wage gain. Real wage gains are strong. In an economy in which 88% of all activity is consumer-based, real wage gains are an important factor in overall economic growth.
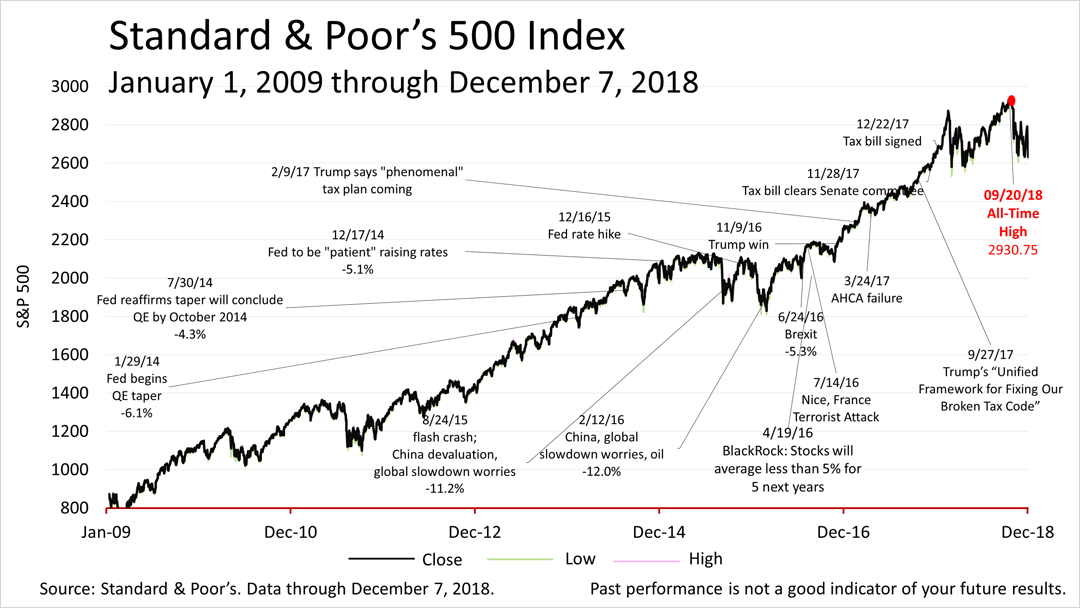
A week ago, the Standard & Poor's 500 rose 4.9% over the previous Friday's closing price. This past week, the S&P 500 lost 4.6%, closing on Friday at 2633.08. No one can predict the market, but volatility is higher and is likely to remain so.
AHE includes 100% of non-farm private employees, and excludes benefits and employers' share of payroll taxes.
This article was written by a veteran financial journalist based on data compiled and analyzed by independent economist, Fritz Meyer. While these are sources we believe to be reliable, the information is not intended to be used as financial or tax advice without consulting a professional about your personal situation. Tax laws are subject to change. Indices are unmanaged and not available for direct investment. Investments with higher return potential carry greater risk for loss. Past performance is not an indicator of your future results.