|
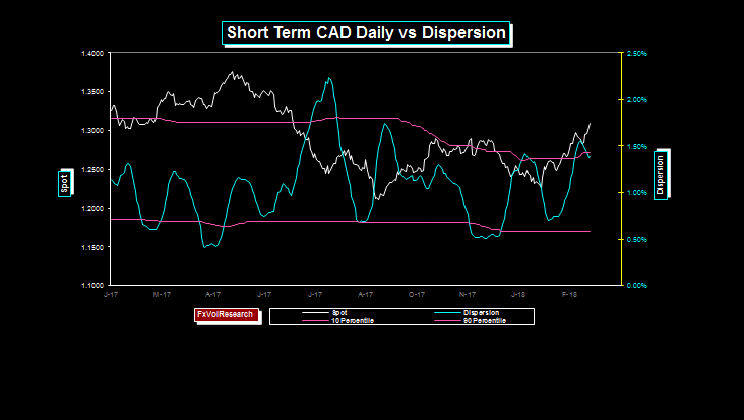
On the daily chart above Dispersion, is rolling over from a high level. This is telling us that the move in the CAD is close to a short-term cyclical top. However, having said that the break above the 1.2925/1.3000 area is significant. We are more likely in store for some good choppy price action either side of 1.3000. There is still ample scope for a larger correction back down into the 1.2675/1.2925 channel.
|
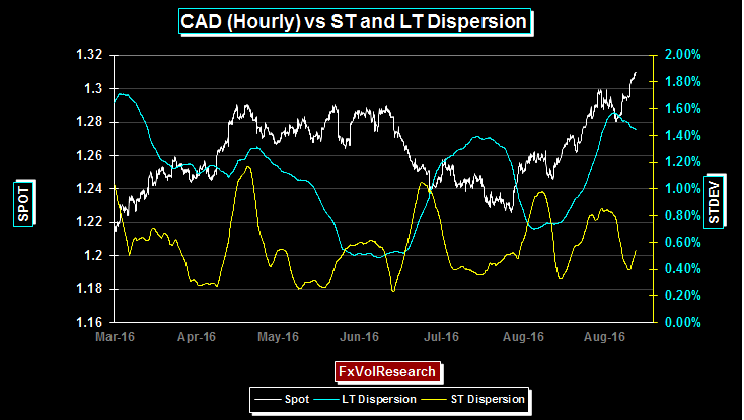
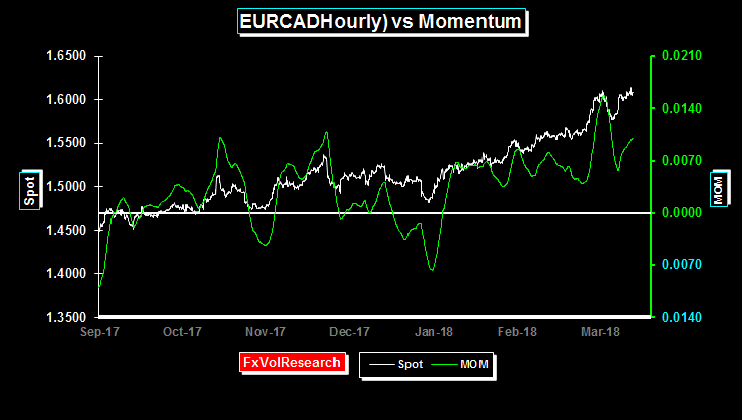
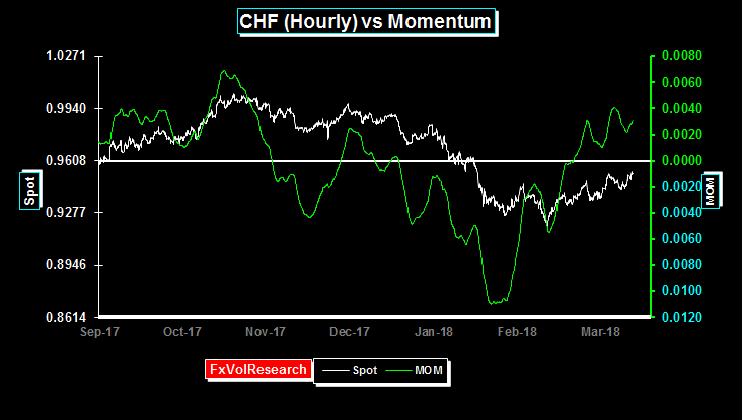
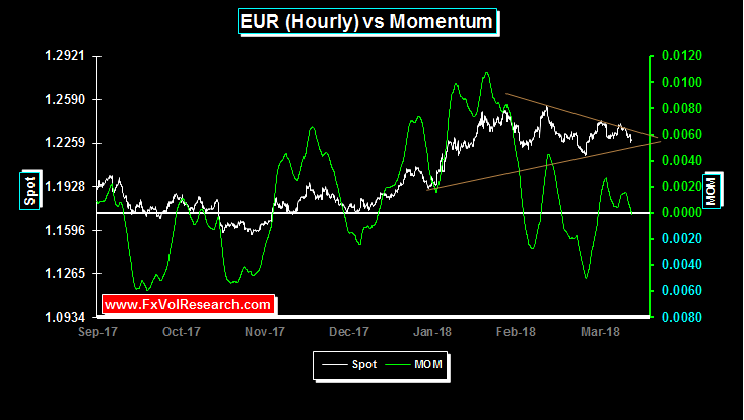
| This is the same chart as above just looking at the hourly data. |
|
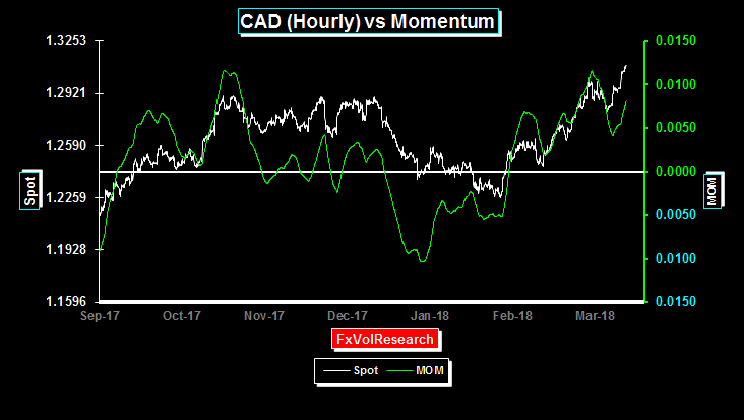
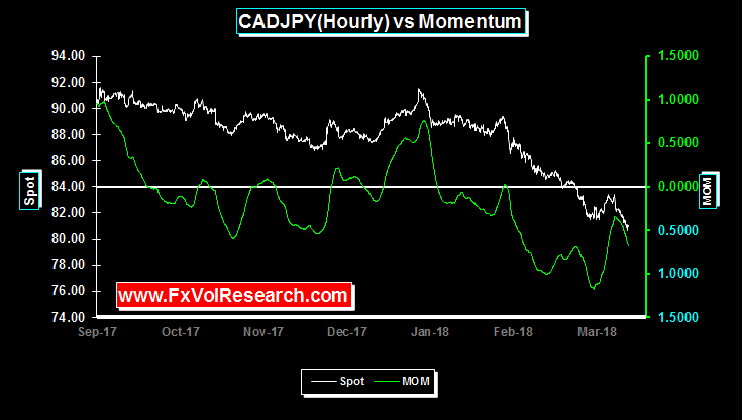
There is divergence here between spot and momentum. This is another reason for caution. We don't want to give the impression that we have turned bullish on the CAD. We have pointed out here many reasons for being a short CAD but at this point, given the extent of the move, there are now grounds for caution in entering into fresh long Dollar positions. While the domestic housing data released last week was bearish and lends support to a softer monetary policy going forward, the CAD is still underpinned by the resilience in the commodity complex and the synchronized global growth story. Those two legs need to be removed to really get the USD back to its previous cyclical highs.
|
|
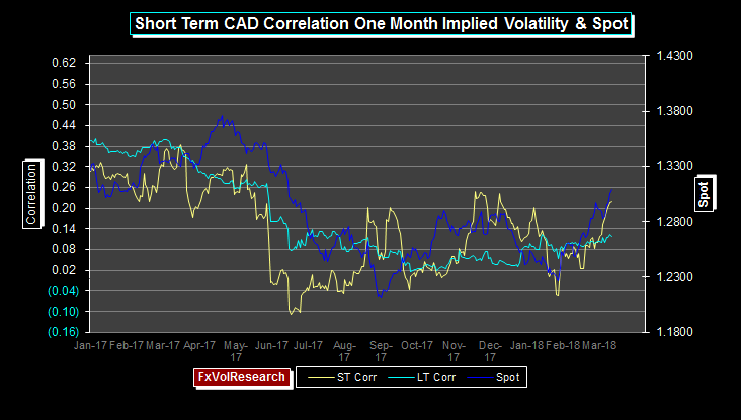
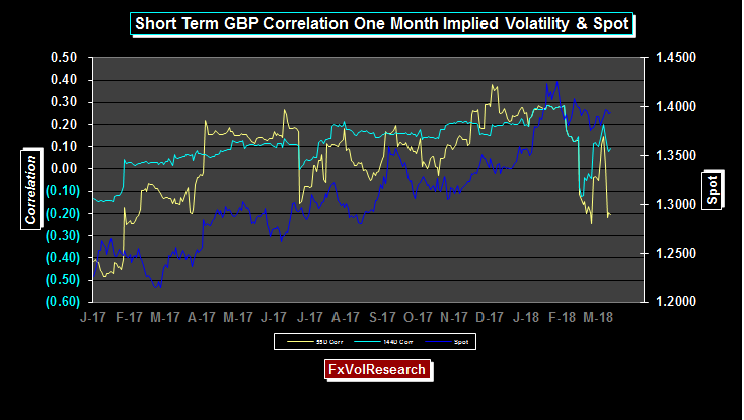
The one indicator that is bullish the USD is the STCIV - short-term correlation of implied vol and spot. However, its use is longer term in nature. Like LT momentum, it tends to signal trend exhaustion at extremes particularly in the context of spot and vol divergence.
|
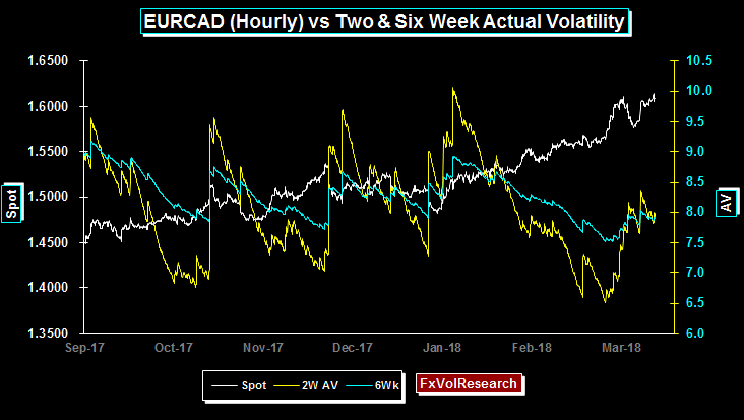
Based on a spot of say 1.6086 based on Fridays implied vols a 3-month 1.6000 EUR put CAD call would cost approx 1.09% of face or translate into EUR points would be 174 tics, producing a break even FX rate of 1.5826. We would get long this for 3-month expiry, and leave an order to buy EUR vs CAD at 1.5500 on the full amount. This would lock in a gain of 326 points and would leave you free to sell the EUR back on a move to the strike at 1.6000. This happy outcome would leave you free to sell the option and close the trade.
|
|
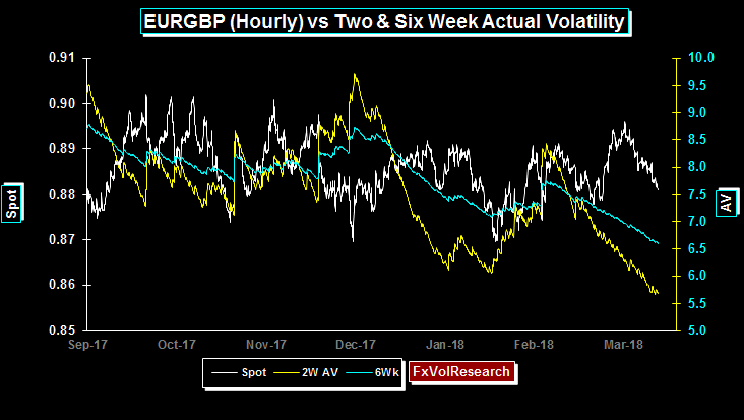
The 3-month trade we mention above would be priced at under 8% vol. As you can see from the chart above the 2week and the six-week realized vols (actuals) are both running at just over 8%. So there is some statistical edge in this trade. The tendency for FX options markets to provide a statistical advantage to the buyer is a topic we will address more fully at a later date. The bottom line is that FX market is so much more efficient than other derivates that the spread you pay for the implied can in many cases be the same or lower than the actuals. This is not something you observer in the VIX for example where the cost of insurance often is well in excess of the actuals.
|
|
| The EUR is exhibiting the same triangle pattern as GBP. There is now a higher probability of a larger EUR downside correction. It is well known that positioning in the EUR futures market is stretched. Momentum is neutral but declining. The USDCHF has rallied over 94 and is also showing clearer signs of upside dollar momentum. Given the on-going revolving door of the Trump administration and the prospect of a political meltdown, it would not an unusual at all to see the dollar lower still. However, the financial markets may now start to factor in an earlier end to the Trump presidency and a return to some semblance of normality. This explanation would also account for the resiliency of the equities in the face of the Administration's protectionist rhetoric. A
counter argument
would characterize this reasoning
as both
complacent and naive. An expanding trade war
particularly at a time when the US current account needs to be financed
would be particularly USD bearish. But for now the financial markets are not buying into this thesis. Either way, a break out from the triangle now seems likely and in our view, it will manifest on the EUR downside with a re-test of 1.2090. |
 |
|
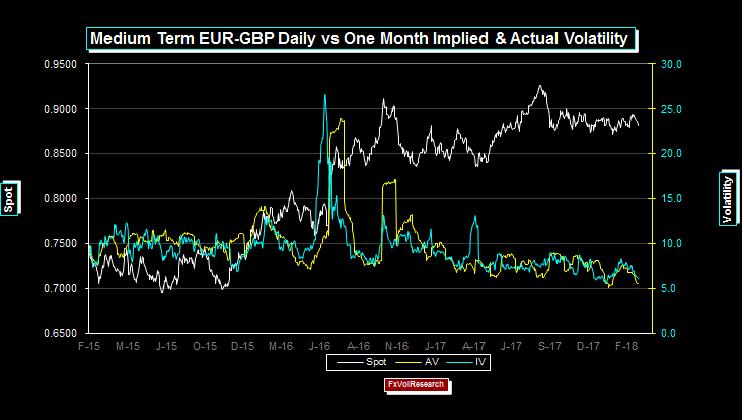
Last week we mentioned the merits of sticking in a low bid for EURGBP one month 25 delta strangles at the 5.9 level. If EURGBP vols continue to decline next week at the same speed as last there is a high probability of getting filled at that level. We continue to like this trade and would retain the bid at 5.9 vol.
|
|
As can see from the chart of the EURGBP hourly actuals above EURGBP vols are declining sharply and this increases the odds of being filled in the strangle trade mention above and last week.
|
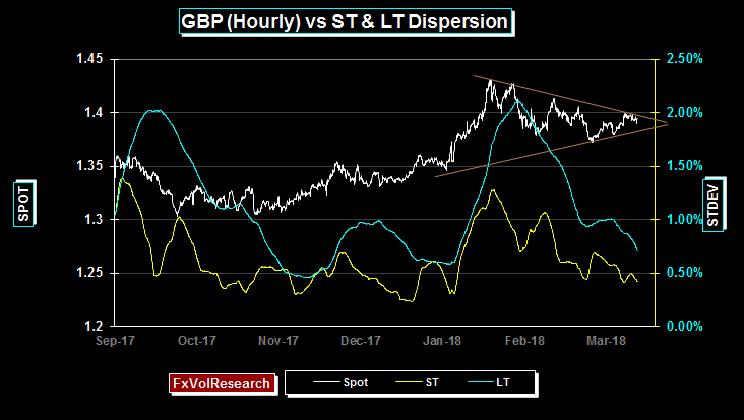
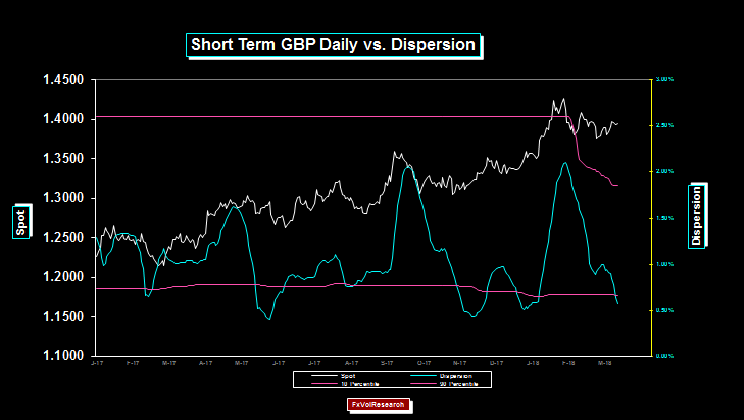
GBP still forming the triangle formation that is common in periods of price consolidation. Dispersion is falling but may now be getting close to being stretched.
|
GBP, STCIV, spot vol correlation is indicating a lessening in the top side trend. A break of the triangle pattern above would confirm a larger downside potential to the 1.3350 area.
|
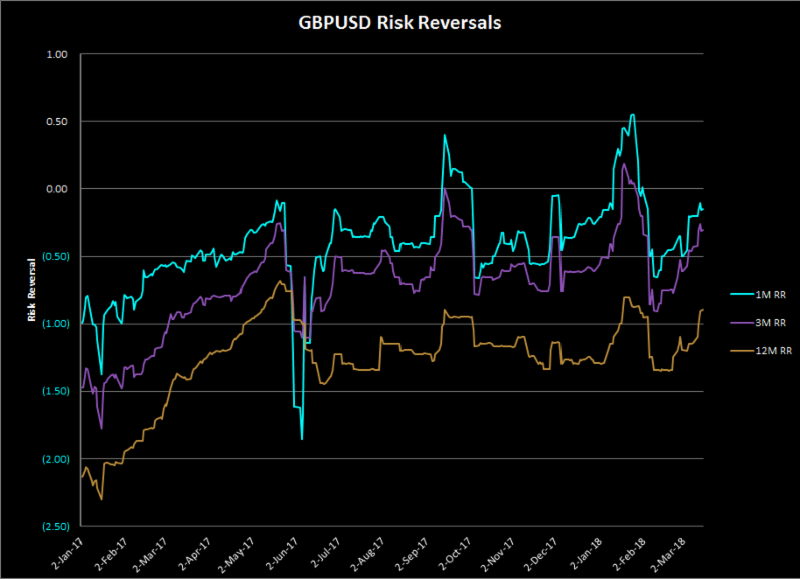
According to our percentile rank models, both 3M and 12m GBP risk reversals are expensive in terms of the premium charged for GBP calls vs puts. As you can see from the chart above both the 1M and 3M have recently traded though par but they were not able to sustain those levels.
|
| GBP daily dispersion is low, but still failing. We are nearing the end of the consolidation pattern. |
|
CADJPY is also showing signs of momentum divergences as you can see in the chart above. We have been bearing on the cross since the 90 level, but at this point, there is a reason to believe that it has gone far enough in the near term and we should start to see some consolidative price action.
|
|
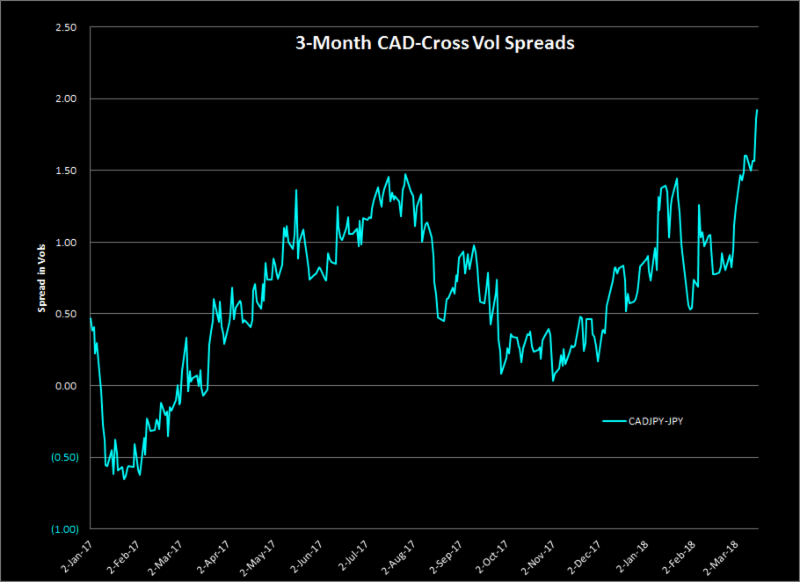
The chart above is the spread in vol terms between 3-month CADJPY implied and USDJPY
implieds
. As you can see we are getting close to 2 vols over. This presents a number of potential trading opportunities. One is to look at CADJPY topside CAD call condors e.g. 81-84-87-90 (long, short, short, long), the other is to consider an iron condor, i.e.
buy
the ATM straddle in CADJPY and sell the 25delta strangles (this is non directional but you are looking for a slow more to the strikes you are short. A more aggressive approach would be to do this trade but do it as a spread vs the USD-JPY. For example, buy the 3M USD-JPY straddles, and sell 3-month CADJPY 25 delta strangles. This is more of a bet that CADJPY correlations are going to become less negative. It would be done in US$ equivalent amounts on the straddle vs the strangle.
|
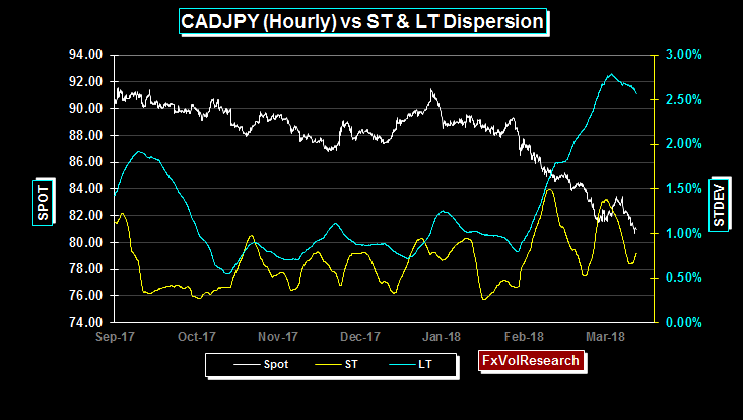
| The LT dispersion indicator in CADJPY is also rolling over, a strong hint that we are near the end, at least for the short term, in the trend. |
CHF short-term momentum moves into positive territory. Are we about to see a broader USDollar rally?
|
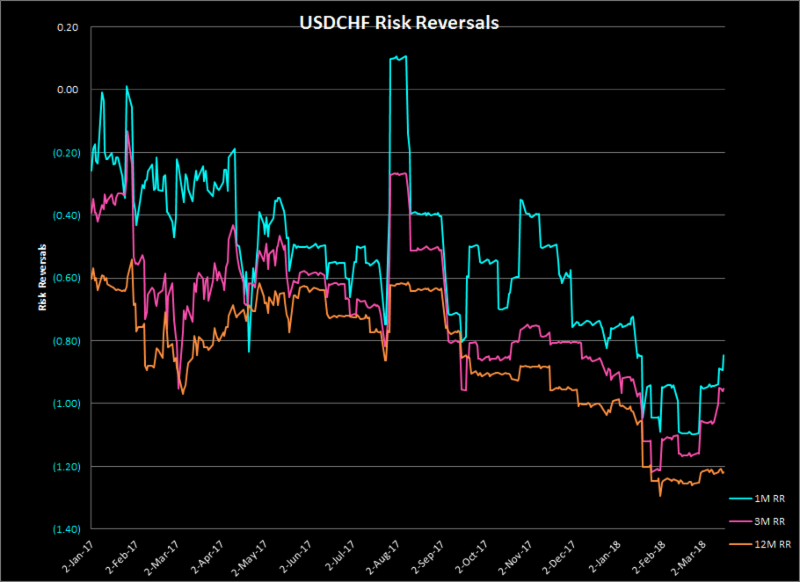
One and three-month USDCHF risk reversals have topped out and are moving to lower premiums for CHF calls. The one year has not budged. The one year remains cheap in terms of the skew charged for 25 Delta CHF puts.
|
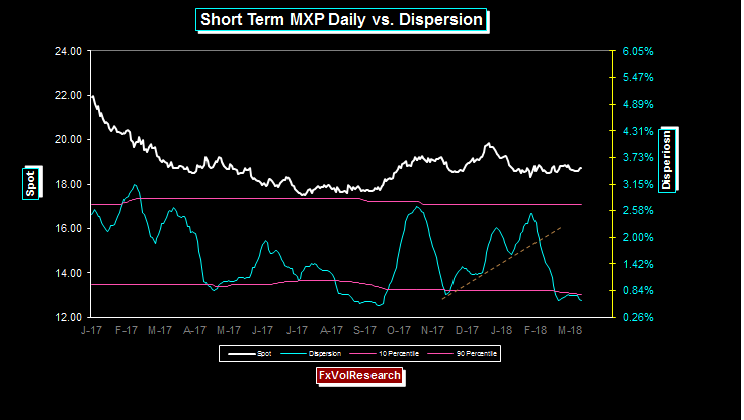
MXP volatilities remained largely unchanged on the week, however, actual vols and dispersion are still declining. The consolidation phase is still intact, for now.
|
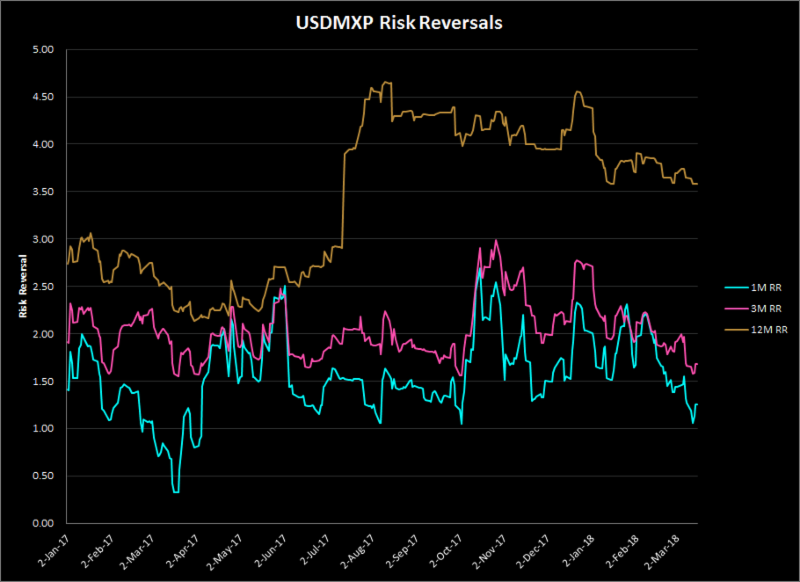
Front-end MXP risk reversals are steadily moving lower. The one and three months periods are particularly cheap on an outright basis and in relation to the one year.
|
Every once and a while, sometimes just for fun I follow up on one or more of the FX investment schemes offered over the web, LinkedIn or online brokers. They send you a brochure. The first question we ask is where are they registered. Answer: Cyprus. Potential red flag.
Cyprus is not a regulatory center that inspires confidence.
You say can you send the pitch book. The returns are good. Too good. You wonder does anyone know how to do due diligence anymore? The second question please send the pitch book. They do. You open it up and have a read. Do they tell you about the principals? No. Do they describe the inefficiency being exploited? No. Then the next question we ask is, Do you report performance data to any of the HF databases? The answer is either no or, " What databases". Final Question: have you filled out the AIMA DDQ (due diligence Questionnaire), and that usually produces the reply What is that? Or, more likely, you never hear from them again. I recall having a long skype conversation with a smooth-talking Englishman who was trying to sell me on a stock index futures strategy that was entirely discretionary. When I asked about the background of the traders he said, "Oh, you want to talk to the traders
? Yes, given that the strategy is discretionary the background and the bio information on the traders are, kinda, important. This had him flummoxed. But then again the leveraged VIX ETF sold to retail investors giving them a perpetual short position was just a high-brow version of the same kind of scam. If you open up the sales memorandum it will tell you your investment is likely to go to zero. These strategies are designed to fulfill one and only one service: to relieve retail investors of their excess cash. But there is a good side to this process of exploration. After doing it for a while and turning over a lot of rocks on the beach, you are able to uncover genuine investment schemes and occasionally even the genuine article. The principals are able to articulate a trading strategy clearly. If it is systematic they will tell you about those circumstances in which the model if overridden. They will tell you how the model evolved and more importantly, the underlying assumptions that underpin the trading process.
If it is discretionary they will still be able to articulate a process by which fundamental data are processed and how balanced portfolios are constructed. They freely depart their background and career bios. And, one defining characteristic they all have in common: they exhibit self-doubt and are disarmingly honest almost to the point of being apologetic. Sell hubris and buy humility.
|
Links (Note I will write about binary options next week)
Canadian regulators ban binary options
https://www.ctvnews.ca/business/regulators-ban-short-term-binary-options-to-protect-canadians-from-fraud-1.3610787
Binary Options brokers that suck
http://www.binaryoptionsthatsuck.com/review/opteck-suck
http://www.binaryoptionsthatsuck.com/review/opteck-suck/
Candian Regulartors Ban binary Options
|
|
Pricing Note:
Sometime in the Spring or early Summer of 2018, the Short version of the
FxVol
weekly will only be available by monthly subscription. The weekly subscription price of the Short version will be less than what you would pay at Starbucks for your daily caffeine fix. The pricing of the Premium Edition will remain the same.
As a subscriber to the premium edition, you will obtain
- Approximately 50 trade ideas/year (all trade ideas have limited downside risk)
- Percentile ranking on all implied & actual vols
- Percentile rankings on
IV-AV
spreads
.
We will continue to issue a free version but it will be issued only monthly.
|
|
Research Director
Direct: 604-685-4414
skype: jamesrider1
Join this distribution list : here
|
|
| |
|
|