|

16 December 2013 - Horror struck Newtown, Connecticut, in such a disturbing way that the nation still struggles with its impact a year later.
A mentally ill 20-year-old recluse obsessed with school shootings enters Sandy Hook Elementary School after the morning bell and kills six adult women, 12 girls and eight boys in 11 minutes. The children were 6 or 7 years old. The heavily armed Adam Lanza, who first killed his mother before taking her car to the school, also killed himself, in a classroom.
On the anniversary of the December 14 slaughter -- under the shadow of another school shooting, this time at Arapahoe High School in Centennial, Colorado -- country and community alike paused and reflected on an event known simply as "Newtown" or "Sandy Hook" and what it says about America on the matters of guns, mental health, healing, and the human spirit.
And we saw plenty ... too many ... charts that showed annual aggregates of gun purchases, mental health and guns, etc. It reflected something I have said before. Americans believe in a God-given right to own a gun ... but not affordable health care.
But it took Periscopic --- an information visualization firm I have written about before --- to bring those lives and what was lost back into the picture, put into perspective. Not long after the shootings in Newtown, they shed some light on U.S. gun deaths with an interactive animation. As I said, we had seen plenty of charts but this was inspired:
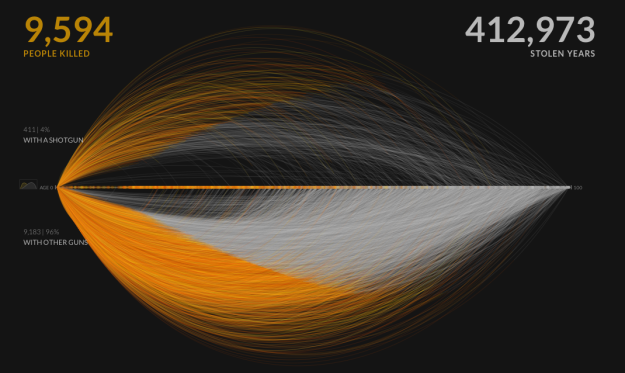
[ Note: this is a sample frame; link to live animation below ]
It starts with the individuals: when they were killed, coupled with the years they potentially lost. Each arc represents a person, with lived years in orange and the difference in potential years in white. A mouseover on each arc shows more details about that person.
You can then select categories and demographics, which provide comparisons between ethnicities, gun type, sex, and others. Roll over the bar in the middle for a density plot representation.
Finally, specific breakouts on the bottom provide notables in the data and what they mean.
There are many routes that you could take with this data. At its core, it's a multivariate dataset with many observations over an entire year. But Periscopic pays close attention to the context and the sensitivity of the data. They make the data relatable while also providing a view of the big picture-without stripping away what the data means.
To see it and work with it live click here.
2013 was a good year for data and visualization. There were several themes throughout the year, but the most important was the strengthened connection between data and reality. During some phases, when so much news was based on speculation and opinion, data was a way to form our own opinions and to view a subject more objectively. But not in that cold, robotic sort of way and more in the warm, human-like way. But the key, as always: even though the data can be considered an objective and factual medium, its connection to the real world is what makes it worthwhile.
We saw an exploration of drone attacks in Pakistan (which helped many understand an otherwise cryptic topic), the continuing talk about Snow Fall by The New York Times ... and the Times on climbing the income ladder and how location matters, wealth distribution in America (which is actually a video but data visualization all the same) .... and, of course, the Guardian piece on those NSA files. Oh, yes, for metadata analysis freaks there was that very funny Paul Revere bit ... which got skewered by the data scientists.
The best events in 2013 to see some brilliant data visualization work were: the annual International Journalism Festival in Perugia, Italy; the Lift Conference in Geneva,Switzerland; Infographics 2013 in The Netherlands; and Computational Aesthetics in Anaheim, California.
On the legal side visualization is becoming increasingly important for understanding information, such as investigative data (for example: computing, medical and crime scene evidence) and analysis (for example: network capability assessment, data file reconstruction and planning scenarios). Investigative data visualization is used to reconstruct a scene or item and is used to assist the viewer (who may well be a member of the general public with little or no understanding of the subject matter) to understand what is being presented.
Analysis visualizations, on the other hand, are usually developed to review data, information and assess competing scenario hypotheses for those who usually have an understanding of the subject matter, most often in e-discovery. The companies on the fast track here seem to be AccessData, Kroll Ontrack, Recommind and ZyLAB, all of which both have data visualization tools to add dimension and context to static information.
And the legal side is getting most interesting. This past year I was an advisor on a case involving databases and spreadsheets/graphics. The query was: is the database itself the real evidence and the spreadsheets/graphics merely "data visualizations" of that database? Is the process of making data "meaningful" to the jury an art form, an expertise, a process requiring fully qualified expert witnesses? It is a fraud case with a fair chunk of change at stake so the questions (and answers) had high stakes.
As data visualization becomes a dominant part of e-discovery ... especially the capability to visualize data relationships ... these questions will become more important.
Gregory P. Bufithis, Esq.
Founder/CEO
The Cloud and E-Discovery
The cloud, Big Data, ediscovery, cloudonomics, data mining,
informatics, analytics, visualization, and other cool stuff
|