I am impressed by all the accomplishments and activity that has emerged from this phenology research community in 2017! There have been an abundance of conference sessions, funded proposals, workshops and peer-reviewed articles thanks to you. Read below about a study which evaluated a statistical estimator for phenology onset dates, and a study which linked ground observations, phenocams, and MODIS data in the Southwest.
I am also pleased to share that the USA-NPN has released a new data type from the Phenology Observation Portal called "Magnitude Phenometrics". You can use this data type to explore regional patterns in animal plant activity across sites throughout the year. Check it out and let us know what you think!
Here at the National Coordinating Office we are busy planning some exciting new products and tools for 2018, including insect pest threshold maps for decision-makers and an improved Nature's Notebook mobile app. I look forward to share these enhancements with you throughout the coming year, and to hear about your new and ongoing phenology research.
Happy Holidays!
|
|
What's new at the USA National Phenology Network
|
|

Indigenous Phenology Network
The USA-NPN is part of the
Indigenous Phenology Network,
a grassroots organization whose participants are interested in understanding changes to seasonality and timing of life cycle events, and forecasting impacts to lands and species of importance to native peoples. The group focuses on building relationships, ensuring benefit to indigenous communities, and integrating indigenous and
western knowledge systems.
Read more »
|

Collecting data to support research needs
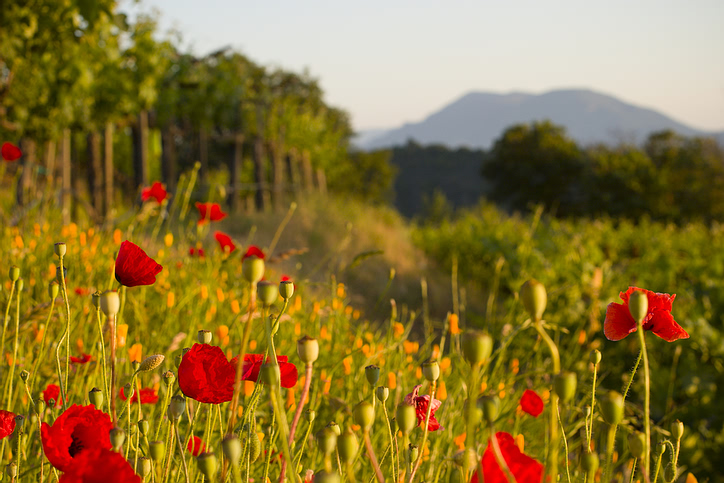
Nectar Connectors is a campaign through Nature's Notebook to build a robust data set for understanding flowering dynamics for monarch butterflies and other pollinators across the United States. Thus far, this effort has yielded data to inform nectar availability across plant genera throughout the year along western and eastern monarch migratory routes.
Read more »
|
 |
New data type for plant and animal activity
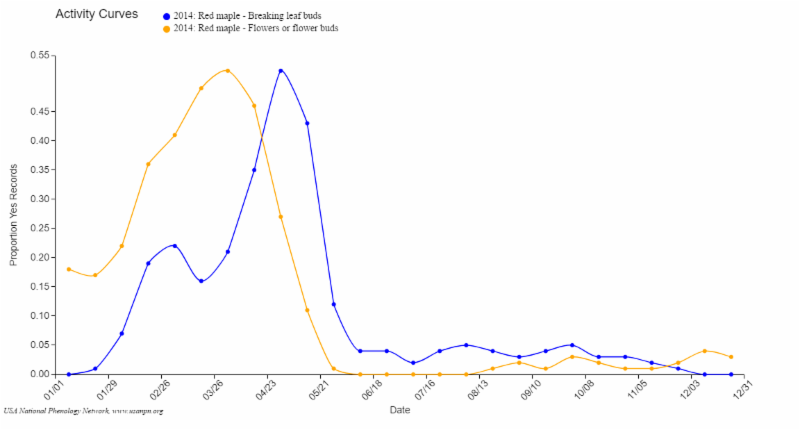
Our new Magnitude Phenometrics data type allows you to explore the annual patterns in the timing and magnitude of phenological activity. You can define time intervals on a weekly, bi-weekly, monthly or over a custom time interval and for a region of interest.
Available metrics include the total number of "yes" records and the proportion of "yes" records relative to the total number of records. They also include several approaches for standardizing animal abundances by observer effort over time and space (e.g. mean active bird individuals per hour). This data type can also be explored in the
USA-NPN's Visualization Tool.
|

Access phenology data with web services
|
|

Forest Service funding for citizen science
A
new grant opportunity
for Forest Service partners will fund several
citizen
science
projec
ts up to $25,000 each. Projects should involve direct data collection or meet a
Forest
Service
information need, have a duration of 6 months or longer, and have a genuine scientific or management outcome. Proposals are due
Jan 31, 2018
.
Learn more »
|
A statistical method to evaluate phenology
A recent study by Pearse and colleagues in
Nature Ecology & Evolution used statistical estimators to calculate unbiased estimates from sparsely sampled data in long-term historic datasets. Using the USA-NPN observational data, they found earlier and more variable phenology in recent years.
|
Phenocams link field and satellite observations
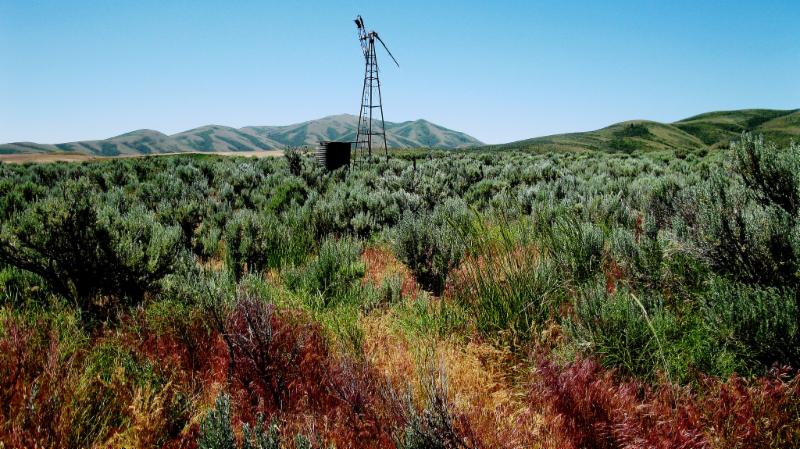
Research reported in
Remote Sensing examined the phenology of two species in arid grassland ecosystems. This study evaluated the correspondence between field measurements, and seasonal metrics derived from phenocams and MODIS NDVI over a 5 year period. Browning and colleagues found that greenness indices were in agreement with mesquite.
|
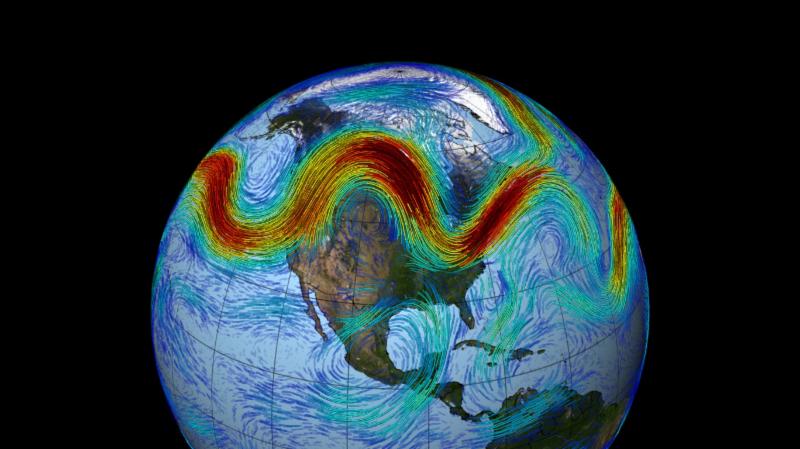
Jet stream indices help understand climate
A study in the journal
Earth Interactions investigated how the position of the North American jet stream relates to broad patterns of precipitation, temperature, phenology, and productivity. Belmecheri
and colleagues used the
Spring Indices to quantify how seasonal
dynamics and plant phenology can be used as a diagnostic tool to link
ecosystem dynamics to atmospheric patterns.
|
|
|
|
|