|
Autumn is here - time for beautiful fall leaf colors, migration of birds back south, and the disappearance of insects from your yard. Goodbye mosquitoes, see you next year!
As things start to quiet down phenology-wise, it's a great time to take a look at the observations you have recorded throughout the year and how they compare to last year. Below, check out a new video tutorial that explains how to use our new
Activity Curves visualization to look at the timing and magnitude of phenological activity throughout the year.
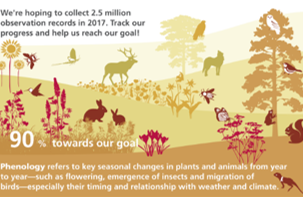
Also, huge thanks for the many observations you have recorded this year! We are already at 90% of our goal of 2.5 million records submitted to
Nature's Notebook this year. On the
graphic above, each plant and animal icon represents 100,000 records. Let's see how far past our goal we can reach this year!
Happy fall observing,
|
|
What your data are telling us
|
Linking bird migration and the Spring Index
 |
|
|
Photo: Tom Grey |
The authors of a study in
Ecosphere used data from two continental-scale observation networks to explore the relationship between migratory birds and environmental cues - observations of migratory birds submitted to eBird and weather surveillance radar, which can detect large groups of migrating birds. They compared the observation data to measurements of vegetation green-up collected via satellites and the USA-NPN's Spring Leaf Index. The Spring Leaf Index was strongly related to both the estimates of bird species richness from eBird observations and migration intensity collected via weather radar. By better understanding how birds and the habitat on which they rely are responding to climate change, managers will be more equipped to take actions to promote and conserve habitat where it is needed.
|
What's new at Nature's Notebook and USA-NPN
|
Predicting fall color across the country
When will trees change to their fall colors in your yard? Predictions developed by X. Zhang and L. Liu from South Dakota State University and Y. Yu at NOAA/NESDIS/STAR/SMCD/EMB use historical and
current satellite information as well as land surface temperature to
estimate the when leaves will change color across the continental U.S.
See the maps »
|
Learn how to explore the new Activity Curves
We've recently released a new graphing option to our Phenology Visualization Tool that makes it easier to view information about animal activity and the synchrony of animal and plant phenology. The new Activity Curves display annual patterns of the timing and magnitude of phenological activity. These are based on the
proportion of "yes" records, animal abundances per hour and other metrics, summarized over a weekly, bi-weekly, or monthly period.
Watch the video tutorial »
|
|
|
|
Photo: Patricia Guertin |
NPN data predict phenological transitions
Your data were used in a recent study published in
PLOS ONE by Crimmins et al. that investigated the extent to which these data can be used to construct models that use accumulated temparature to predict phenophase transitions. The authors were able to construct 107 models for different species-phenophase combinations, showing that there is great potential to develop enhanced predictive models of phenophase transitions using data curated by the USA-NPN.
|
|
Recent happenings in the field
|
|
|
|
Photo: Greg Wilker, USFWS |
The ripple effect of phenological change
Researchers recently found that climate change can drastically alter Kodiak bear's diets, with cascading effects in their ecosystem
. The authors of the study, published in PNAS, found that in warmer years, red elderberries - a favorite bear food - ripened early enough to overlap with salmon season. Almost all bears opted to spend time away from streams eating berries, and the salmon were nearly untouched by bears. This dramatically altered the environment in those years, as no salmon carcasses were left on the river banks to provide important
nutrients for other animals or
vegetation.
|
| Nature's Notebook Nuggets |
Fall into autumn phenology!
Our Nature's Notebook Nugget on fall leaf color answers all your burning questions about how to observe deciduous plants in the fall. When it comes to reporting on colored leaves, any amount of color (regardless of the reason) means a 'yes'. If reporting on intensity, consider the percent of color in the canopy respective to the canopy at 100% fullness - and it might take a year to know what this looks like for your plant.
|
|
More ways to get involved
|
This fall, you can help monarchs and other pollinators by documenting fall flowering of milkweeds and other important nectar species! Join the Nectar Connectors campaign, and collect data that will help the US Fish and Wildlife Service and other managers know where and when nectar is available for pollinators such as monarchs as they make their way south this autumn.
|
|
|
|
Tom Lujak and Mark Schwartz, Photo: Jason Rieve
|
Phenology and changing spring on the radio
USA-NPN co-founder Mark Schwartz was recently featured on
WUWM Milwaukee Public Radio and discussed how the USA-NPN tracks the change in the onset of spring over time. Hear how Mark initially developed the models we use to predict the onset of spring, why lilac data are used in these models, and the important contributions citizen scientists have made to this effort.
|
|
|
|
|


