|
Above is three months implied volatility for three major currency pairs: EUR, GBP & Yen. As you can see all three have bottomed with EUR rising off the lows and now just crossing over GBP vols. Yen vols have found good support at the 8% and that remains a good level to get long. Using longer term models based purely percentile rankings they are still historically lower than their long term averages. Of the three GBP vols offer some of the best value when considered in relation to their most recent actuals.
|

|
|
Above is the major CAD - cross vols in 2017, year to date. Correlation is the main driver of the premium over the $ - based pairs. The more negative CAD - Cross correlations the higher the vol. However, cross currency correlations can change and when they do this makes using CAD-cross options much more interesting. A negative correlation extremes cross vols are overpriced relative to the Dollar legs, and at a high level of positive correlations cross vols are too cheap relative to the dollar legs. These are the considerations that go into to relative value or 'soft arbitrage' types of trades. Having said that they can also be useful for private investors and corporate hedgers to stay on top of them so they can implement either the most cost effective hedge or alternatively, most effective trading view.
|

|
|
Short term AUD dispersion has rolled over and the LT is close to doing so. Most of the upside trending price action in the AUD is complete and we can expect either sideways consolidation of a modest correction. It is also worth pointing out that the RBA expressed some concern with the level of the AUD when it was over 80 cents. This by no means suggests that the move higher is complete but it does strongly suggest that over the next few weeks we will see a period of consolidation. As we mentioned here several weeks ago, the leveraged community has, collectively, been negative on the AUD and these positions have likely been unwound. The macro view underpinning these trades was that AUD would be a derivative casualty of the major China slow down story. The scenario has been China has some sort of credit event that triggers a hard landing and that in turn leads to a commodity price implosion. A similar meme has been concocted for CAD. This macro story has been around for a while. And it may well play out at some point, but the key has been timing the move. And so far at least, the timing has been poor. This macro view also hinges on the build up of private debt in Australia, particularly in the housing market and the potential of a disorderly unwind. These are the broad macro themes that have to underpin the short AUD story, but they have not come to fruition. This does not mean of course, that they can't happen. The other possibility, that should be considered, is that China orchestrates the softest re-balancing of the economy with only a mild slow down in growth, but with a smooth hand off from export led to domestic based consumption. While many would regard this as less probable it is an outcome that should not be dismissed entirely. In our view, paying close attention to the commodity bloc is so important in trying to assess what is really happening in China since so much of the official statistics are treated with skepticism. Appart from the technical indicators we look at, on the macro level, a good deal of quality data can be gleaned by looking closely at the level of intra-regional Asian trade. For example, Singapore's Non-oil net exports are a good example of highly reliable data that has not been filtered or spun for political advantage.
|
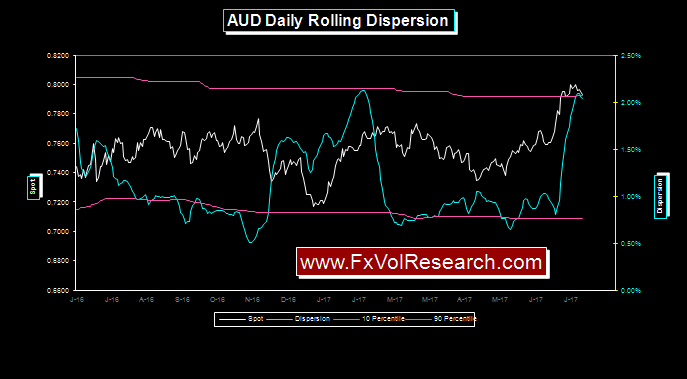 |
Looking at daily as opposed to hourly dispersion with the AUD tells a similar story.
|
| AUD risk reversals never quite made it to par and in the last week, the premium for AUD puts has increased relative to calls. Notice too that move of the move was in the front end of the RR curve and not the one year. |
| CAD shows a stronger indication of trend exhaustion and the potential for a gradual correction. |
|
CAD daily showing still stronger indications of trend exhaustion. Both actual and implied vols are likely to fall from here over the balance of August. CAD trades that make sense are short vol with limited downside risk and decay short CAD up to the 1.3000 level.
|
Like the AUD RR, CAD risk reversal also failed to get through par, and not surprisingly the correction in the spot has led to strong demand for out-of-the-money $-Calls (CAD puts). Like the AUD most of the move in the front end but still not an entirely modest move either in the one year. Corporate Canada decided to do some hedging.
|

|
As pointed out here last week, 5YR CAD bond yields have had their run and are now likely to consolidate with yield volatility declining. The CAD employment report came in slightly below expectations while the US report was solid. US-CAD interest rate differentials thus moved back slightly in
favour
of the dollar. The key point is that the BoC is essentially removing the two 25bp cuts they administered following the oil price slide. These moves were controversial at the time, and in my view, unwarranted. Now they are simply unwinding those moves and are more prone to be data dependent going forward. The central bank at one point was giving the market the green light to short the currency and that is not something any central bank really ought to do. In fact, one could argue that the recent volatility of the CAD has been generated more by confusion in communicating forward guidance to the street.
|

|
Initial signs of divergence in CAD-JPY that we noted last week are now developing into a bearish momentum
|
Copper makes new highs and then levels off with Copper actual vol declining on the week. The commodity complex is supported by global growth but it does not seem to be accelerating. At a minimum, this should provide the Dollar block currencies some underlying support until it tops.
|
|
Declining dispersion in the DJ Commodity price index is another sign that the momentum in the commodity complex is simply, not accelerating. Prices are well off their lows but there is still lots of topside resistance to clear.
|
The EUR is holding on to its hourly trendline (just). Notice how the two week actual vol is trying to hold over 8%.
|
EURCAD takes out the hourly trend line and dispersion is rising but not from significant lows. If ST indicator breaks above the LT that would increase the odds of a larger trend developing but right now the indicators are murky at best.
|
EURCAD risk reversals, in particular, the 1M and 12M, move sharply on the week in the direction of better premium bids for EUR calls over puts.
|
EURCHF
hourly dispersion just about to roll over and imply that the move in EURCHF is mostly done. This is a good example of cross currency vol being driven by correlation break down mention above in the CAD-Cross example.
|
EURCHF
risk reversals leveling off and in the one month losing some of their premia for EUR calls. Fear is leaving the market.
|
Interesting that while EURGBP is just about on track to make a new cyclical high, EURGBP vols are still low. On the basis of IV-AV spreads they are fair value. Buying 3M EURGBP vol here and delta re-balancing on assumption that we are in a volatile uptrend would be the preferred trade here. Thus over-hedging on corrections and obviously letting the deltas run if we take out the previous cyclical high.
|
|
The correlation of spot and implied vol has also backed off slightly suggesting a short term top is in place. It is not suggesting a trend reversal but more likely a period of price consolidation. Combined with the break higher in the hourly actuals it increases the odds of a choppy period of price consolidation.
|
|
Sterling is holding on to the hourly trend line using daily data. GBP vols remain undervalued in relation to the recent actual volatility.
|
|
While GBP held the daily trend line it failed to hold the hourly trend line.
|
Momentum divergence highlighted here last week has now developed further into a clear negative momentum reading.
|
Yen actual vols holding stable around the 8% level. The spot move on Friday did not take out the downward sloping trend line.
|
MXP
actual vols accelerating lower, as the spot makes a slow correction back in
favour
of the Dollar.
|
This is the move in the 12M MXP risk reversals mention last week. Look at the one year move in relation to the front end of the curve. Obviously, some serious hedging going on in the long dated MXP options. Is there a trade here?
|
|
Research Director
Direct: 604-685-4414
skype: jamesrider1
Join the FxVol Free Weekly: here
|
|
| |
|
|


