FXVOLRESEARCH
Weekly FX Review
May 26th,  2017


 Strong signs of momentum divergence in EURCAD. The rally may well have come too far too fast. A pattern also apparent  in the EURJPY chart below. 
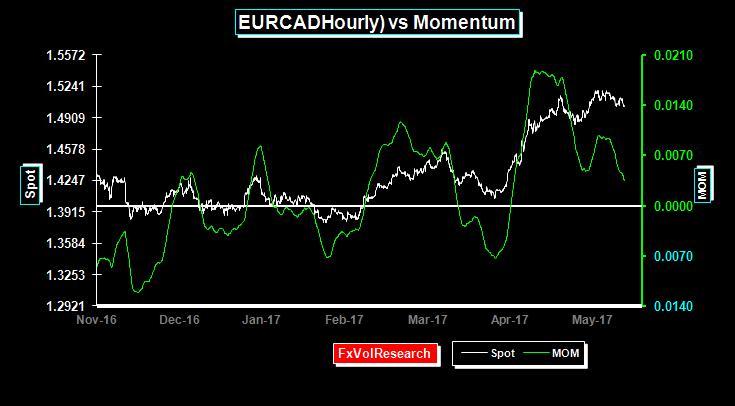
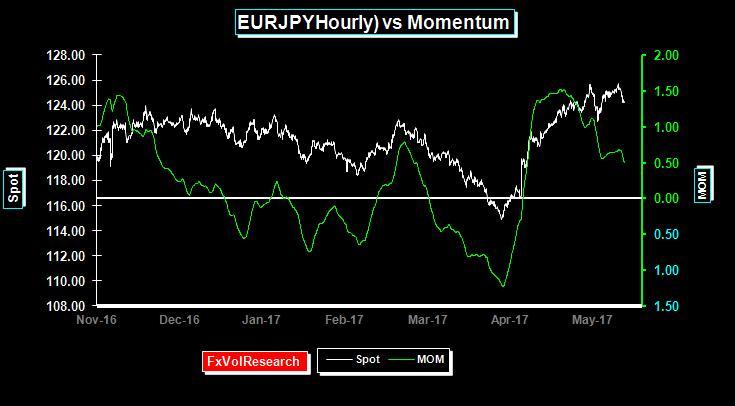
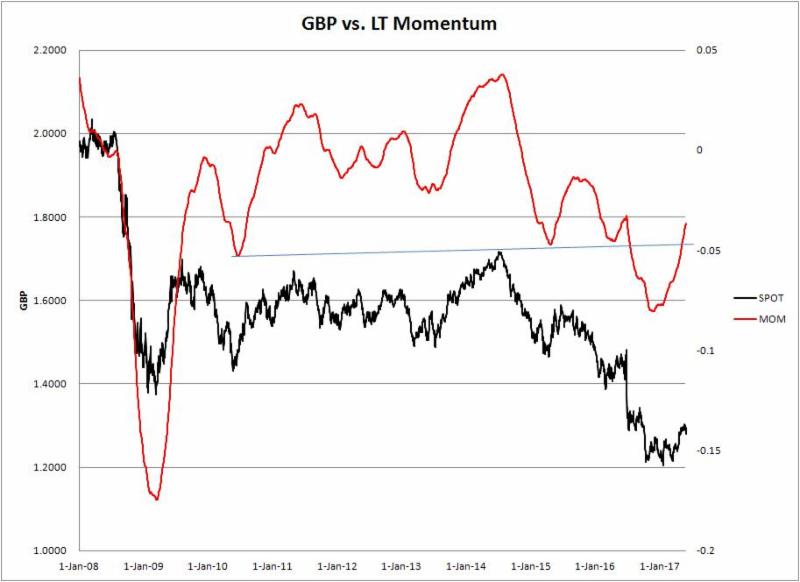
 Momentum divergence is a useful indicator, more so than momentum on its own. Using signals generated from simple momentum indicators generally produces a profit and loss account than mean reverts over time. However momentum divergences,  in our view,  have a better track record in identifying countertrend price action. 
 GBPCAD too looks like it is rolling over and is due for a period of consolidation. The six week STDEV has topped out while the shorter-term STDEV is rising off a low level. Taken together it suggests further downside potential for cable. 


Similar picture with GBPJPY with Friday's sell offf not leading to much of a rally in GBPJPY actual vol. 


The unwind of the so-called Trump trade has corresponded with a persistent MEX peso rally. The peso now seems to be flat lining above key support. MEX risk reversals however remain well bid for US$. 


The US$ rally ran into significant topside resistance at the 1.3800 level. However as US-CAD trade relations seem set to deteriorate in the near term the C$ is likely to remain under pressure. The leg lower suggests a somewhat weaker trading range; with good support around 1.3350 and topside resistance around 1.3750. The volatility of the C$ along with the AUD are very dependent on what happens to the commodity complex in general. As commodity price vol has been trending lower, in particular oil, and copper, so too has the C$ vol declined. This trend is likely continue over the summer, and the C$ may find short term support from a seasonal rally in the oil price. However, this is likely to change in the fall. 


T he chart above shows GBP risk reversals from 2017. 25 delta GBP puts have been steadily losing their premium all year and nearly made it back to par. However that trend was reversed this week with the most recent batch of opinion polls and GBP move lower. 

    
    One month EUR risk reversals ahead of the French election touched a low of 4 vols over for EUR puts over EUR calls. Following Macron's victory and the sharp EUR rally EUR RR have traded back up to just over par in the front end. However, like GBP, that trend reversed later this week with EUR puts once again commanding a tiny vol premium over calls. 


 The longer term C$ implied & actual vol trend has been lower with occasional short term periods where owning gamma has been rewarded. As you can see from the chart above the 3M actual is testing the 6% level and the implied vol is not too far behind. 6% is historically good support on the charts for 3M C$ vol and my guess is that it will prove a tough nut to crack. 


The rally in the EUR following Macron's election is fully justified. The markets attention is becoming more focused on the unwinding of populist pressures in the EU and real prospect of a still closer union. Trump's isolationist rhetoric may actually support this along with the departure of the UK. Meanwhile the big picture is still one of declining vol  amid a trading range that encompasses 1.05 and 1.15. 3M EUR vols closed still lower on Friday and are now at levels last seen in 2014. While cheap they can get cheaper still.  


GBP rally back to 1.3000 has led to a modest improvement in GBP momentum indicators but they remain in negative territory. The failure at 1.3000 is not going to help. It is not too hard to imagine EUR-GBP going to par in the next year. GBP back to 1.2000 and the EUR the same.  


Like Canada, the Aussie has seen a steady vol decline over the last year; with the implieds in this case under the actuals. The leveraged community is almost universally short and this raises the potential for an AUD short squeeze rally if the rally in the  commodity complex where to resume. The bearish sentiment is predicated on the China slow down or hard landing scenario that has yet to materialize. China has been doing a better job than many give them credit for orchestrating a soft landing.  The risk is that the process of rebalancing combined with levels of debt lead to a disorderly unwind. Commodity prices are likely a better indicator or what is going on with the real economy than the official GNP stats. 


Best Regards, 
 
James Rider
FXVOLRESEARCH  

Direct: 604-685-4414
Cell: 778-882-4773
skype: jamesrider1


Send me an email if you would like  to be added to this weekly distribution list.