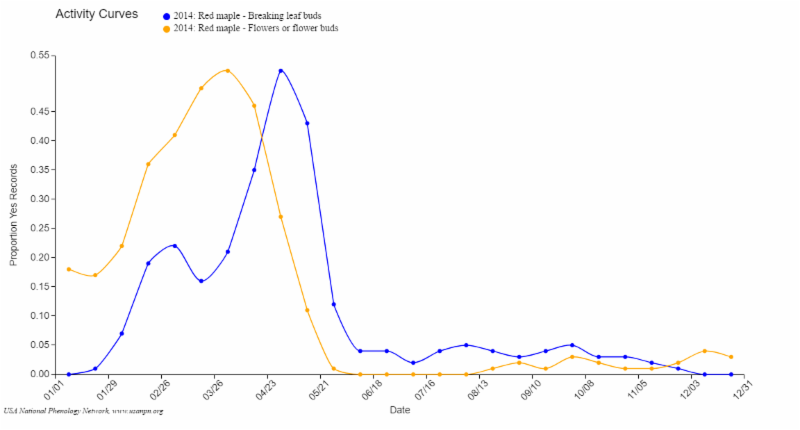
As spring transitions into summer across much of the country, we are gearing up to release a suite of new features to our Visualization Tool that will make it even easier for you to explore the data within the National Phenology Database.  We anticipate that these features will allow users to explore many interesting questions, such as: How synchronous are birds and leaf-out? How does peak intensity vary across years? and, How does the shape of phenophase activity vary across species? 

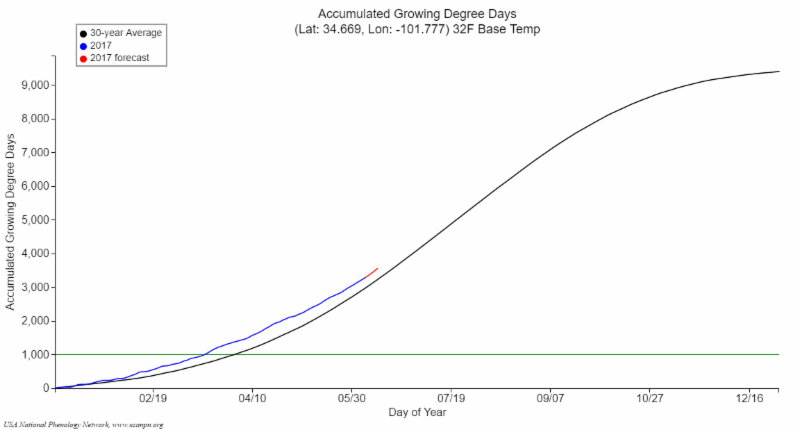
In addition, you will be able to better leverage our Accumulated Growing Degree Day maps to determine how rapidly your site is accumulating heat relative to the long-term average, and to know when a location has crossed a known threshold for phenological transitions in your species of interest.  Stay tuned for these exciting developments! 

I hope to see many of you at the Ecological Society of America meeting in Portland this summer. In addition to the many phenology-focused sessions throughout the week, there will be a phenology brown bag lunch on Tuesday August 8th. This will be a great opportunity to interact with fellow phenology researchers and learn about the latest scientific advances in the field! 


What's new at the USA National Phenology Network
USA-NPN database reaches ten million records

In April the National Phenology Database crossed a new milestone to reach 10 million observation records!  Each record is a response to a question about phenology activity for a particular plant or animal species on a unique day or time, by a unique observer. 

Data collected by dedicated Nature's Notebook  participants continues to roll in at a higher rate each year and is being used for many research applications to date. We encourage you to explore and download the data for phenology studies! 
 
Read more » 

Data and data products
Create activity curves in Visualization Tool

This summer we are adding a new graphing option to our Phenology Visualization Tool that will display annual patterns of the timing and magnitude of phenological activity based on Status and Intensity data at one or more site. These will be based on the proportion of "yes" records, animal abundances per hour and other metrics, summarized over a weekly, bi-weekly, or monthly period.  If you would like a sneak preview of the new Activity Metrics  visualization and a chance to provide feedback,  email Kathy .

Interact with Growing Degree Day maps

Stay tuned for an additional new feature on the visualization tool that will allow you to explore the daily accumulation of temperature at a location, and compare the rate to the prior year and the long term average. Users can set an AGDD value to see the date a location crossed a threshold, or anticipate when it will do so based on a 6-day forecast. If you would like a sneak preview of the new AGDD  visualization and a chance to provide feedback,  email Kathy .


Opportunities
Upcoming meetings    
field.jpg
Special Issue on phenology
 
There will be a special issue in the journal Remote Sensing in Ecology and Conservation on "Patterns, Trends, and Ecological Applications of Phenology".   The Submission Deadline is October 31st, 2017. 

Research spotlight
How do MODIS spring green-up products compare to ground observations?

A new article by Peng et al. in Ecological Indicators used USA-NPN in-situ data and Ameriflux data to compare and validate multiple spring green-up phenology products.  This study evaluated how derived phenology products from MODIS NDVI and EVI time series correlated with ground observations. They found a stronger relationship between the ground data and the remote sensing data with EVI-based spring green-up dates. 

Oak phenology varies across species and regions

USA-NPN data on oak leafing and flowering was used in a recent study in the Journal of Ecology to demonstrate sensitivity to climate and geography.  In water-limited systems in the Western US, species tend to display phenophases intermittently throughout the year with longer phenophase durations, whereas species in temperate systems are more likely to have one distinct seasonal period of activity. Western species are also more influenced by geographic location independent of climate.

Elecia Crumpton, University of Florida
Songbirds can't keep up with shifting spring

A new study in the journal  Scientific Reports reveals certain migratory songbirds are unable to keep up with the shifting start of spring. The authors used satellite imagery to track the start of spring green-up, which provides food for caterpillars and other insects. These insects are important food sources for birds during their journey and as they arrive at their summer breeding grounds. 

The authors found that of 48 species studied, 9 displayed a mismatch between spring green-up and their arrival date. The gap between green-up and arrival increased by over half a day per year. Mismatch between a bird and the peak in its food source can impact survival of adults and young, with cascading effects across generations.
Contact

 
Kathy Gerst
Associate Research Scientist
Data Product Coordinator
520-621-1740
bio