Dr. Lappe's latest research paper was published in the March 28th edition of JAMA. Since that time, due to some specific wording in the paper, there have been headlines around the world such as "Vitamin D, Calcium Supplements Have No Impact On Cancer Rate, New Study Shows," or "Vitamin D pills may not protect against cancer after all."
These headlines give the impression to readers that there was no reduction in cancer as vitamin D level increased. That is not so.
So why is it being reported this way?
The abstract, or summary of the paper, is often all that people see unless they subscribe to the journal or pay for the paper. In the abstract to this paper it states
"Conclusions and Relevance - Among healthy postmenopausal older women with a mean baseline serum 25-hydroxyvitamin D level of 32.8 ng/ml, supplementation with vitamin D3 and calcium compared with placebo did not result in a significantly lower risk of all-type cancer at 4 years. Further research is necessary to assess the possible role of vitamin D in cancer prevention."
"Significantly"
When a layman reads this text, it can be understood to mean that there wasn't a meaningful reduction in risk - or that the vitamin D + calcium group did not have fewer cancers than the placebo group. However, this is not true.
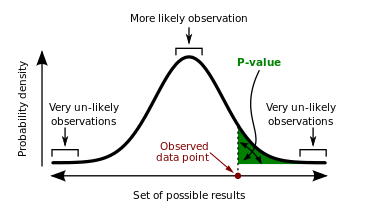
"Significance" in scientific research terms is a computation done during data analysis to evaluate the strength of the evidence. It is also called the P-value. In this paper it was reported as such (from the results section of the abstract)
"A new diagnosis of cancer was confirmed in 109 participants, 45 (3.89%) in the vitamin D + calcium group and 64 (5.58%) in the placebo group (difference, 1.69% [95% CI, -0.06% to 3.46%]; P=.06)."
The P-value is a probability, it is a percentage. In this calculation the P-value was .06, which means that there is a 6% chance that this result (30% reduction in cancer in the vitamin D + calcium group) was due to chance - not the actual treatment. In a different wording, that means you are 94% sure it was NOT chance! The scientific community has agreed that P=.05 or less is an accepted amount for study results to have "significance" and anything higher than P=.05 is "not statistically significant." There is no middle ground, it is black or white.
When you are making a decision for public health, is 94% 'enough'?
Year 1 data usage
On page 7 of the paper, under 'Post Hoc Analyses,' when participants who withdrew from the study or developed cancer within the first 12 months were excluded from analysis, the study reports a 35% reduction in cancer in the vitamin D + calcium group compared to the placebo group with a P-value of .047 - it was statistically significant!
Why would we take out year 1 data? This chart explains it well if you are a visual person. For the two groups, the first year, cancer incidence was almost identical. You can see the yellow and blue lines are on top of each other. After a year they start to separate.
Why would it be useful to remove a year's worth of data? If you can imagine a cancer diagnosis during the first year of the study - was it due to what they did that year? It is likely that those cancers diagnosed in the first year of study would not have had the time to be affected by vitamin D + calcium. In Lappe's first cancer study she analyzed it the same way, excluding the first year of data in the final analysis.
Analysis by Serum Level
If you are reading this newsletter you probably already agree that vitamin D levels need to be tested - that two people taking 2000 IU vitamin D per day may have drastically different blood levels.
We have shown that using your data.
For this study if you analyze by serum level, using all the data - not excluding year 1 - this is what the graph looks like (and is found in the supplemental content).
Where would you want your vitamin D level to be? On the left or the right side of this graph?
Analyzed by serum level, the data showed that participants with a vitamin D level of 55 ng/ml were 35% less likely to get cancer as compared to those with a vitamin D level of 30 ng/ml, with..... a P value of .03 - it was statistically significant!
Vitamin D supplementation in the placebo group
To enroll in the study you needed to be a post-menopausal woman, independently living, 55 years or older, who responded to a recruitment mailing.
First of all you can imagine the population to respond would be one that cared about their health and whether supplements were helpful for a disease free life.
Secondly, since the US RDA for that population is between 600 - 800 IU/day vitamin D (600 IU/day for ages 50 - 70, 800 IU/day for those over 70), and a participant would not know whether or not they were in the treatment arm or the placebo arm - they were allowed to supplement with vitamin D up to 800 IU/day.
In addition, there was a high average vitamin D measurement at the start of the trial (33 ng/ml) - which means there was not a big difference in vitamin D levels between the placebo and treatment arms. That is why analysis by vitamin D level is so important - it is not only how much they are taking, but what serum level they achieved that matters.
Summary
ALL these studies have shown a reduction in incidence of cancers (from 30% to 77%).
ALL these studies have show a very good confidence rating, from < .005 to .06.
What actions should be taken?
This data tells us the probability of cancer reduction is high for public health.
We also know that vitamin D is safe, inexpensive and easily available. What decision will you make?
What is the cost of NOT taking vitamin D to achieve a serum level between 40 and 60 ng/ml?