Here's To Your Wealth
March 2017
|
|
The Markets:
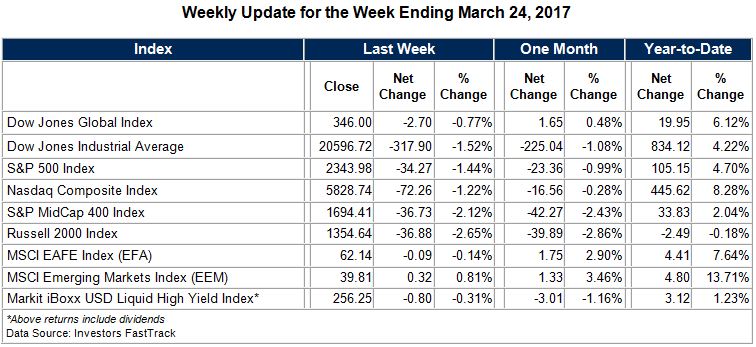
The U.S. Stock Market performance soared from the November elections until the end of February. And to borrow from a well-known phrase, March's performance came in like a lion and is going out like a lamb. The good news is that although the Dow Jones Industrial Average has fallen over 500 points as of March 28th, on a percentage basis, because of the markets lofty level, this decline is only about 2.5%.
[1]
Given the growing uncertainty about tax and infrastructure legislation, elevated stock market valuations, as well as daily tweet risk coming out of Washington, market volatility should be expected by investors. However, until March 21st, the stock market had gone over 100 days without a 1% decline, and seemed to only want to price in the good news coming out of the "Trump growth agenda".
[2] With some recent legislative stumbles we now see some of that earlier stock momentum slowing. Washington will need to deliver on the agenda Wall Street is hoping for or the post-election gains may seem unjustified.
Perhaps surprisingly, we see the legislative roadblocks not just coming from the Democrats, but from divisions within the Republican ranks. We saw this lack of unity with the effort to repeal and replace The Affordable Care and Patient Protection Act. Now there are concerns that consensus may not be able to be reached regarding tax reform and infrastructure spending - two aspects to the Trump agenda that have been nearly universally praised by Wall Street. On the one hand, most Republicans want to lower personal and corporate tax rates, but there are those in the "Freedom Caucus" who are also concerned about the ballooning budget deficit and more spending. For some conservatives, cutting taxes must be accompanied by spending cuts, but if entitlements like Social Security and Medicare are off limits, there is little else to cut - especially since President Trump wants to increase - not cut - defense spending. Whatever your personal feelings are regarding lower tax rates, at this point, the failure of Congress and the President to reach a robust tax deal represents one of the biggest risks to stock prices. For more on this topic, click here to see my discussion with Trish Regan on "The Intelligence Report", March 9th on
Fox Business Network.
As I have written before, the biggest driver to stock prices is earnings, and corporate earnings have been strengthening. In addition to stronger corporate earnings, the U.S. continues to enjoy low unemployment, an uptick in personal incomes, continued low oil prices, and relatively low U.S. interest rate. All of these factors could spell optimism for the U.S. equity market. Interim market declines may also present opportunities for investors with cash on the sidelines - provided that the growth story continues and we see some tax reform and infrastructure spending out of Capitol Hill.
Globally, we still see continued easing by the Bank of Japan and the European Central Bank. And while there are major structural problems to the European economy, there are signs that economic growth may finally be at least limping forward. If political turmoil doesn't derail their nascent economic recovery, European stocks may also finally move upward after years of under performance.
To summarize, we continue to believe the bull market in U.S. stocks that started over 8 years ago remains intact. Elevated valuations are concern at these levels, there is geopolitical risk, and potential gridlock in Washington. But the earnings outlook remains robust. Central Banks, including our own Federal Reserve, are being very careful to create a recession, and barring an unforeseen black swan type event, we don't see a recession in 2017. Increasingly, our best advice is to not get too emotional about politics or your portfolio, and to avoid watching cable news - unless of course I am a guest.
|
 |
"A tax loophole is something that benefits the other guy. If it benefits you, it is tax reform."-Russell B. Long
Mark Avallone and the Potomac Wealth Advisors Team
P.S. Please feel free to forward this commentary to family, friends, or colleagues. If you would like us to add them to the list, please reply to this e-mail with their e-mail address and we will ask for their permission to be added.
Potomac Wealth Advisors, LLC
15245 Shady Grove Road, Suite 410
Rockville, MD 20850
Phone: 301-279-2221
Securities and Investment Advisory Services offered through H. Beck, Inc., Member FINRA/SIPC. 6600 Rockledge Drive, 6th Floor, Bethesda, MD 20817 301.468.0100. Potomac Wealth Advisors, LLC is not affiliated with H. Beck, Inc.
This material represents an assessment of the market environment at a specific point in time and is not intended to be a forecast of future events, or a guarantee of future results. This information should not be relied upon by the reader as research or investment advice regarding any funds or stocks in particular, nor should it be construed as a recommendation to purchase or sell a security. Past performance is no guarantee of future results. Investments will fluctuate and when redeemed may be worth more or less than when originally invested.
Diversification and asset allocation do not guarantee against loss. They are methods used to manage risk.
This report has been derived from information considered reliable, but it cannot be guaranteed as to accuracy or completeness.
This report has been derived from information considered reliable, but it cannot be guaranteed as to accuracy or completeness.
|
|
|
The indexes are constructed and weighted using market value-weighted index. They provide 95 percent market capitalization coverage of developed markets and emerging markets. More than 3000 DJGI indexes provide data on more than 5500 companies around the world. Market capitalization is float-adjusted *The DJIA is a widely followed measurement of the stock market. The average is comprised of 30 stocks that represent leading companies in major industries. * The Standard & Poor's 500 (S&P 500) is an unmanaged group of securities considered to be representative of the stock market in general. *The NASDAQ Composite Index is a market-valued weighted index, which measures all securities listed on the NASDAQ stock market. *The S&P Mid Cap 400 Index This Standard & Poor's index serves as a barometer for the U.S. mid-cap equities sector and is the most widely followed mid-cap index in existence. To be included in the index, a stock must have a total market capitalization that ranges from roughly $750 million to $3 billion dollars. Stocks in this index represent household names from all major industries including energy, technology, healthcare, financial and manufacturing.
*The
Russell 2000 Index is a small-cap
stock market index of the bottom 2,000 stocks in the
.
* The
MSCI EAFE Index is a
stock market index that is designed to measure the equity market performance of
developed markets outside of the U.S. & Canada. It is maintained by
MSCI Barra,
[1]a provider of investment decision support tools; the EAFE acronym stands for
Europe, Australasia and Far East.
* The MSCI
Emerging Markets Indexs a float-adjusted market capitalization index that consists of indices in 21 emerging economies: Brazil, Chile, China, Colombia, Czech Republic, Egypt, Hungary, India, Indonesia, Korea, Malaysia, Mexico, Morocco, Peru, Philippines, Poland, Russia, South Africa, Taiwan, Thailand, and Turkey.
* Opinions expressed are subject to change without notice and are not intended as investment advice or to predict future performance.
*The economic forecasts set forth in the presentation may not develop as predicted and there can be no guarantee that strategies promoted will be successful.
* Consult your financial professional before making any investment decision.
* To unsubscribe from the "Potomac Wealth Advisors, LLC newsletters" please reply to this email [email protected] with "Unsubscribe" in the subject line, or click below Safeunsubscribe. You may also write us at "15245 Shady Grove Road, Suite 410, Rockville, MD, 20850
|
|
|
Learn more about Mark Avallone's recently released book, Countdown To Financial Freedom
 Recognized by:
The Washington Post
as a Greater Washington DC Region Five Star Wealth Manager (2015)
The Financial Times
as one of the country's Top 401 Retirement Plan Advisor (2015)
Private Wealth Magazine
as a member of their Inaugural All-Star Research Team (2012)
Washington Business Journal
as one of Washington's Premier Wealth Advisors (2011, 2012, 2013, 2014)
NABCAP
as one of the Top Wealth Managers in the Washington, DC Metropolitan Region (2011, 2012, 2013, 2014)
SmartCEO Magazine
Magazine Money Manager Award Recipient Finalist, Washington, D.C. Metropolitan Region
(2015)
Consumers' Research Council of America
as one of America's Top Financial Planners (2011, 2012, 2013, 2014)
DC Magazine
as a Five Star Wealth Manager, Washington, D.C. Metropolitan Region (2012)
SmartCEO Magazine
Magazine Top Wealth Manager, Washington, D.C. Metropolitan Region
(2012)
Financial Advisor Magazine
as an All-Star Research Manager (2012)
|
 |
|
|