|
The Dangerous Allure of Average Returns
Not All Investment Performance
Averages Are Created Equal
|
March 24, 2017 - Consult most any financial resource about the historical average annualized return for the S&P 500 and most will provide the same generic answer. About 10%.
Going back to 1975, the correct answer appears to be precisely 9.91% if you calculate averages the way you were taught in school. Add up all the numbers then divide by the number of years.
"Average return is the simple mathematical average of a series of returns generated over a period of time."
- Investopedia -
To most people, this means any bonehead could have plunked down, say, $100,000, into a mutual fund that mirrored the S&P 500 in 1975, left it alone, and at the end of 40 years they would have ended up with . . .
(. . . $100K x 9.91% = $9,910,
add that to the $100K, now you've got $109,910,
multiply that figure by 9.91% then add again,
push some more buttons, write down answer,
do this 40 times to equal . . .)
. . . $4,812,420 ignoring any management fees, constant compounding, transaction costs, etc.
It's easier if you build a spreadsheet but either way, that's a sensational return if you've got 40 years to wait and $100,000 to start with, isn't it?
Simple, right?
But don't count your imaginary good fortunes just yet because even though you're right, you're wrong. In fact, you're probably WAY wrong considering . . .
Plain Old Averages Can Mislead
No, your math skills are just fine and averages do mean something after all. Just maybe not as much as you've been led to believe for a few reasons not the least of which is the fact that simple average returns and the Global Investment Performance Standards (GIPS) time-weighted average returns will yield different numbers.
|
|
|
Because the index earns or loses more in some years than others, your final sum can vary
significantly depending on how the index performs each year and when it rises or falls.
So, what is the correct answer to the question "What did $100,000 become if it tracked with actual results of the S&P 500 from 1975 through 2015?" (Cue drum roll sound track, please)
Closer to $2,980,387 not counting the compounding and reinvesting dividends, etc. Or $1,832,033 (38%) LESS than the figure calculated above.
|
Just Your Average Red Herring
This is where people usually fall victim to the allure of past investment performance averages. They take the stated past performance averages and assume a static return going forward to arrive at their planned future portfolio value.
While this is a nice exercise, it's unwise to rely too heavily on your calculation.
It may seem disingenuous to suggest averages don't matter at all but your wallet will thank you if you take the time to fully appreciate a major shortcoming of investment performance averages when considering where to place your hard-earned dollars:
Average Returns Don't Tell The Whole Story
To clarify this point, let's take a shorter view things and look at another example:
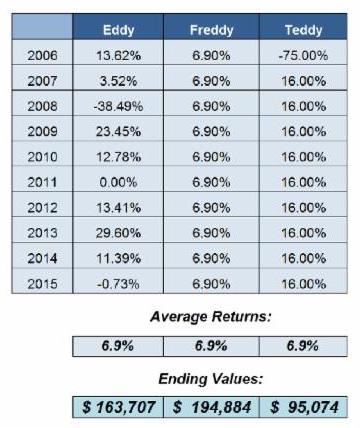
From 2006 to 2016, the S&P 500 averaged 6.9% ranging from a low of minus 38.49% (2008) to a high of 29.60% (2013).
NOTE: Total average return of 69% divided by 10 years = 6.9%
So, it's easy to estimate what $100,000 might grow to over the next ten years simply by multiplying 6.9% to each year's starting balance for 10 years in a row, right?
Not so fast.
Meet Eddy, Freddy and Teddy
One hypothetical set of pre-retiree triplets, Eddy, Freddy and Teddy, were always competitive and decided one day to have a "race" to retirement by seeing who could emerge as the smartest investor over a ten year period of time.
Each brother invested $100,000 in 2006 but because their approaches to investing and the timing of their success (or lack thereof) varied, all three ended up with different sums at the end of 10 years even though their (non-GIPS) average returns of 6.9% were the same.
Eddy always followed the rules and did exactly as he was supposed to do. Not surprisingly, after 10 years, his account tracked the S&P 500 to a tee.
Freddy liked routine. He ate the same thing for breakfast every morning and was so predictable that railroads used to set their watches by his habits. His fund earned precisely 6.9% each and every year. No more. No Less.
Teddy believed in hunches and frequently gambled. A friend offered to let him in on the ground floor of a "can't miss" business opportunity and Teddy went all in. It turned out Teddy's friend miscalculated the demand for sauerkraut shampoo and this first venture was a bust. Teddy got out after losing a hefty sum but recovered nicely over the course of the next nine years.
After 10 years passed, all three of the brothers
averaged 6.9% returns but "Steady" Freddy came out ahead nearly doubling his investment, netting him a tidy profit of about $95,000 before taxes.
Eddy, mirroring the S&P 500, also did well making a profit of almost $64,000 before taxes and fees. That one bad year during the Great Recession really took its toll, however.
Poor Teddy, though. Despite clobbering his siblings from 2007 through 2015, that first year loss really did a number on him. Despite averaging 6.9% like his brothers, he LOST almost $5,000.
No more hunches for Teddy.
Risk, Return and Reward
|
Teddy's example is purposely extreme to make an important point:
Losing Money Matters More Than Averages
For the same reason Teddy could average a phenomenal 16% return over nine years but still end up licking his portfolio wounds in the minus column due a first-year shellacking, many people today still can't bring themselves to celebrate this most recent post-Great Recession bull market and fear another bear is lurking. The impact was very real to them:
Planned retirements were postponed, in some cases indefinitely.
Managed settlements funds designed to meet specific income commitments fell short requiring reassessment of needs.
These and similar worries can be mitigated when clients choose guaranteed income structured settlements, structured attorney fees and retirement income annuities.
In over 25 years of offering clients fixed term guaranteed future income solutions, I have yet to ever hear back from anyone regretting their decision to annuitize some of their funds. I have a hunch not all money managers can make the same claim since it's not uncommon for them to field calls from anxious investors when portfolio balances decline.
We believe you can increase your own chances of future financial bliss if you follow our firm's fundamental approach to post-settlement and retirement income decision making. Before you contemplate the hypothetical, follow the sensible and start with these two basic rules:
RULE 1: Match future income needs with guaranteed future income dollars.
RULE 2: Don't expose money to risk if you can't afford to lose it.
Do whatever you want with the rest of your money but "cover your bases" first. Structure
some of your settlement. Structure
some of your attorney fees. Dedicate
some portion of your retirement portfolio to annuities. In all but a few scenarios, a balanced approach to future income planning is the smartest approach.
On a related note, even though we know what's driving it, we are disturbed by a recent trend we're noticing of people being advised to over-allocate their settlement dollars into managed trust accounts. We are especially concerned to see this happening so frequently with cases involving minors and others who are most vulnerable.
But we'll leave that topic (and the adverse impact of fees, taxes and risk of loss) for another day. For now, I've taken enough of your time and look forward to discussing any of this with you at your leisure.
Thank you for the opportunity to be of service and best wishes for continued success in your personal and professional lives.
The Best,
Dan Finn,
CPCU, MSSC™, RICP®
Master's Certified Structured Settlement Consultant™
Retirement Income Certified Professional®
|
NOTE: This newsletter is presented for educational
purposes only
using material freely available in the public domain and should
not be construed as tax or legal advice. All rights reserved.
Average Image courtesy of Stuart Miles at FreeDigitalPhotos.net
|
|
Our Services
The Finn Financial Group provides customized, guaranteed future income options and ancillary services to a variety of clients throughout the United States. We pride ourselves on our commitment to the overall financial well-being of the individual. For a greater understanding of the services we provide, click on your area of interest.
Click the image to the right to watch a short intro video about The Finn Financial Group or visit us at:
|
About Finn Financial Group
The Finn Financial Group is a full-service, specialty planning firm with a commitment to ensuring the long-term financial stability of its clients. We believe this can best be achieved through a stream of guaranteed, tax-advantaged payments carefully tailored to each individual's specific needs. Our diligent work has resulted in a long list of satisfied clients across all lines of advocacy and a high degree of trust.
Impacted by a Hip Recall?
If you have been impacted by the recent DePuy ASR Hip Recall, Finn Financial Group is here to help.
Find out more and watch an informative video now at www.ASRHipSettlement.com.
|
|
|
Dan Finn, CPCU, MSSC™, RICP® | Finn Financial Group, LLC | 949.999.3322 FinnFinancialGroup.com | CA Insurance License: 0A96173
Thank you for reading our newsletter!
|
|
|
|
|
|