By now I hope you've had a chance to explore the new features we released this summer to our Visualization Tool! We anticipate that these features will allow users to explore many interesting questions with USA-NPN data and data products. For example, you can now create customized activity curves to ask questions such as: How synchronous are frugivorous birds and ripe fruits? How does peak intensity of leafing vary across years? and, How does the shape of phenophase activity vary across species? Stay tuned, as we will soon be releasing this product as a new data type called "Magnitude Phenometrics" in the Phenology Observation Portal.
Below you can also read about some new phenology research that has been published recently using USA-NPN data for applications such as determining thermal thresholds, evaluating land surface phenology products, and investigating factors that affect the timing of bird migration routes. I continue to be so impressed by all the innovative phenology science you are doing! Keep reaching out, asking questions, suggesting improvements, and let us know how we can support your work.
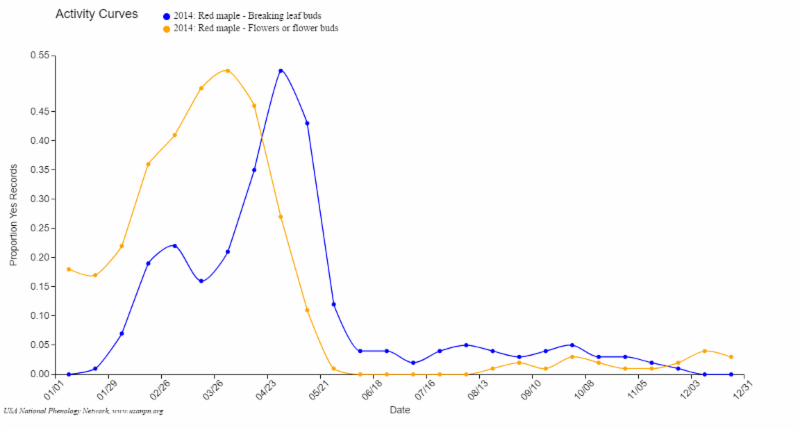
Check out the new feature to the Phenology Visualization Tool that displays customized Activity Curves of annual patterns of the timing and magnitude of phenological activity based on Status and Intensity data at one or more site. Plot up to 2 curves for up to 8 metrics, such as the proportion of "yes" records or animal abundances per hour summarized over a weekly, bi-weekly, or
monthly period. This Fall these data will be released as a new data
type called "Magnitude Phenometrics" via the Phenology
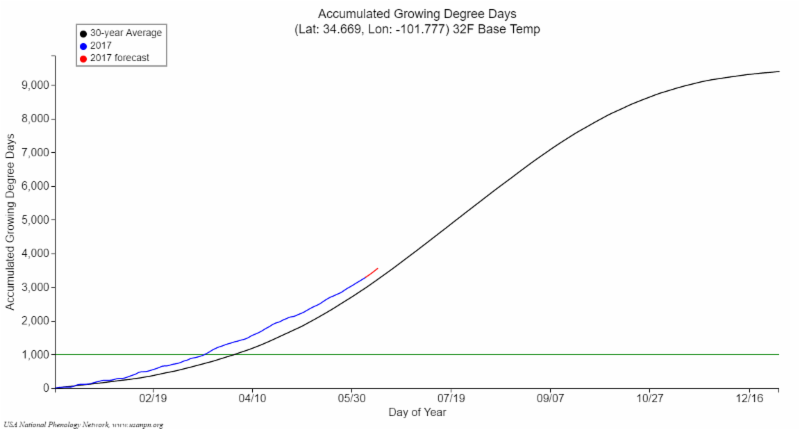
You can now explore the daily accumulation of temperature at a location, and compare the rate to the prior year and the long term average. Users can set an AGDD value to see the date that a location crossed a threshold, or anticipate when it will do so based
on a 6-day forecast. This feature can help a manager determine
whether or not to mobilize field crews to monitor species of interest.
Locations where AGDD has reached between 2000 and 12,000 units as of May 1st, 2017
Create threshold maps
Within the Phenology Visualization Tool, you can also now create customized threshold maps showing where a given AGDD value or AGDD range has been reached on a given day, or create a map showing a range of locations that the Spring Indices have been reached on a given day or range of days of year. This facilitates many applications for decision makers. For example, a land manager can use these maps to determine where and when to treat for insect pests or invasive species.
NEON is currently looking for individuals to join 20 different technical working groups comprising experts in the fields of science, education and engineering. Nominate yourself or someone else!
There will be a special issue in the journal Remote Sensing in Ecology and Conservation on "Patterns, Trends, and Ecological Applications of Phenology". The Submission Deadline is October 31st, 2017.
USA-NPN data used to predict phenological transitions
The
National Phenology Database was used in recent study published in
PLOS One by Crimmins et al. that investigated the extent to which these data can be used to construct simple thermal time threshold models. The authors were able to construct 107 individual species phenophase models, showing that there is great potential to
develop enhanced predictive models of phenophase transitions using
Intercomparison of Land Surface Phenology products using in-situ observations
A new article by Peng et al. in
Agricultural and Forest Meteorology used USA-NPN
in-situ data and Ameriflux data to evaluate Spring green-up dates derived from six Land Surface Phenology products. Overall the researchers found Root Mean Square
Error values of ~ 20 days and significant correlations with ground
Birds adjust migration routes to optimize arrival times
A recent study in
Ecology and Evolution found that the stopover strategies for migratory birds are influenced by a bird's time-schedule, which is influenced by the habitat conditions experienced in their annual cycle, as well as the distance remaining to their breeding destination. This study used the
Spring Indices to evaluate the timing of the start of spring at their research sites.