|
We're excited to announce upcoming training opportunities to help you get started with your phenology monitoring programs. We will be hosting a new, 2-day phenology monitoring training course at the National Conservation Training Center on November 2-3. This course is an excellent opportunity to receive guidance from USA-NPN staff on how to design a long-term, sustainable phenology monitoring program to help you get the phenology data you need. The course follows a 3-day Citizen Science Workshop that will discuss citizen science opportunities in the FWS more broadly. We hope to see you there!
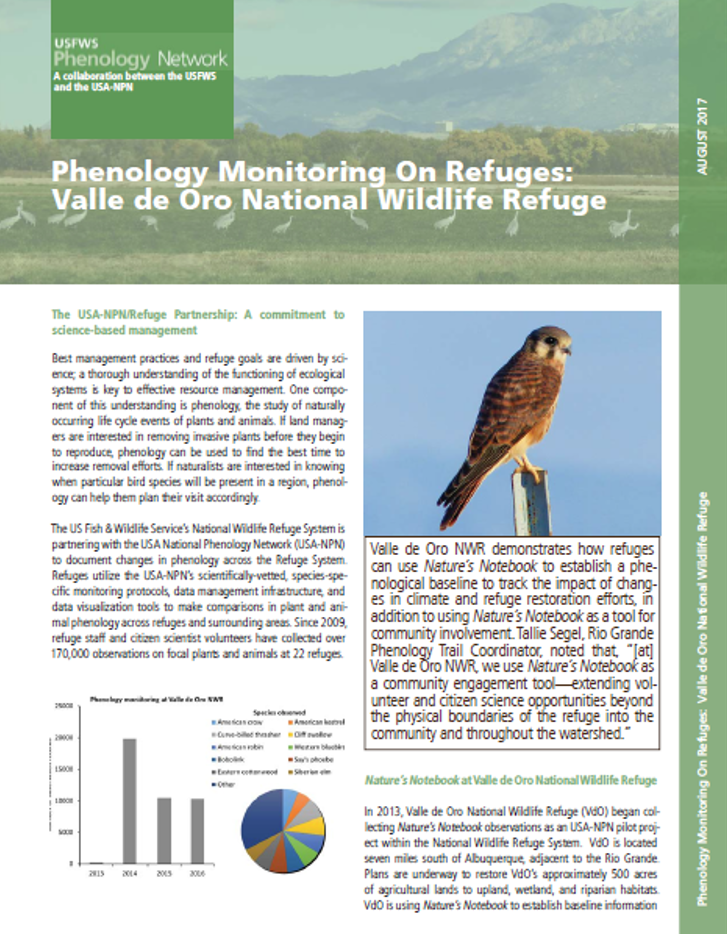
Need some inspiration for how a phenology program can help you to meet your goals? Check out our five new Refuge Highlights that describe how refuges are using phenology monitoring with Nature's Notebook to improve schedules for managing invasive species, document species richness and abundance before and after restoration activities, understand the link between climate variables and timing of leaf-out of wildlife forage, and more!
Sincerely,
 |
and
|
 |
|
USA-NPN
USFWS Liaison |
USA-NPN
Education Coordinator |
|
|
Learn how 5 refuges are tracking phenology
We've created one-page highlights of the ways that five different refuges are using
Nature's Notebook
to better understand phenology of species of interest. Learn about what these refuges are finding so far:
|
 |
|
|
Photo: Sue Wilder, USFWS |
Barataria Preserve joins Gulf Coast PhenoTrail
Barataria Preserve at the Jean Lafitte National Historic Park and Preserve is the latest partner to join the Gulf Coast Phenology Trail. The Preserve will engage staff, volunteers, and school groups in making observations on a variety of native plants. Local Phenology Leaders at the Preserve recently held a training workshop for over 20 participants to kick off their program. If your Refuge is on or near the Gulf Cost, we invite you to join the Trail!
|
|
|
|
Photo: USFWS |
Nature's Notebook training at Neal Smith
Neal Smith NWR is hosting a
Nature's Notebook training this weekend to get their phenology monitoring program up and running. Neal Smith hosted USFWS Liaison Erin Posthumus earlier this year for a phenology program planning workshop. The Refuge settled on a list of species to monitor to answer questions about how phenology of native species might be changing and how best to manage invasive plants. Interested in a similar workshop for your Refuge? Email
[email protected].
|
|
|
New Resources for our Refuge Partners
|
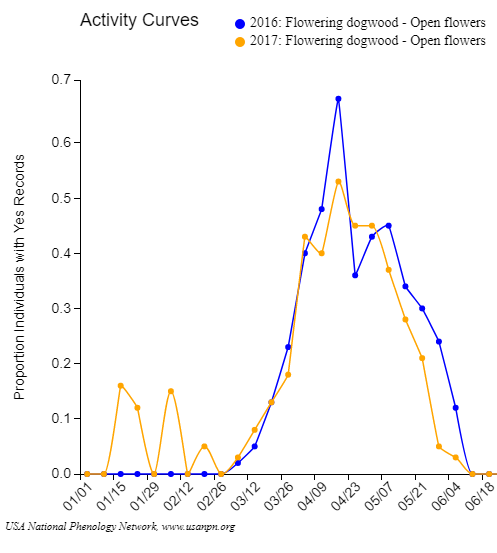
Learn how to use the new Activity Curves
Our new Activity Curves, hosted in the
USA-NPN's Visualization Tool, display annual patterns of the timing and magnitude of phenological activity.
Plot up to 2 curves for up to 8 metrics, such as the proportion of "yes" records or animal abundances per hour summarized over a weekly, bi-weekly, or monthly period.
These Curves allow you to answer questions such as: How synchronous are frugivorous birds and ripe fruits? How does peak intensity of leafing vary across years? and, How does the shape of phenophase activity vary across species?
|
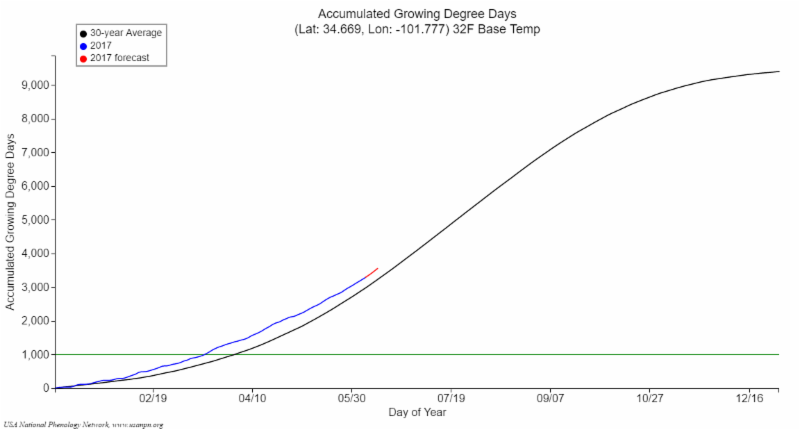
You can now explore the daily accumulation of temperature at a location, and compare the rate to the prior year and a 30-year average. Set an Accumulated Growing Degree Day (AGDD) value to see the date a location crossed a threshold, or anticipate when it will do so based on a 6-day forecast. This feature can help a manager determine whether or not to mobilize field crews to monitor species of interest.
|
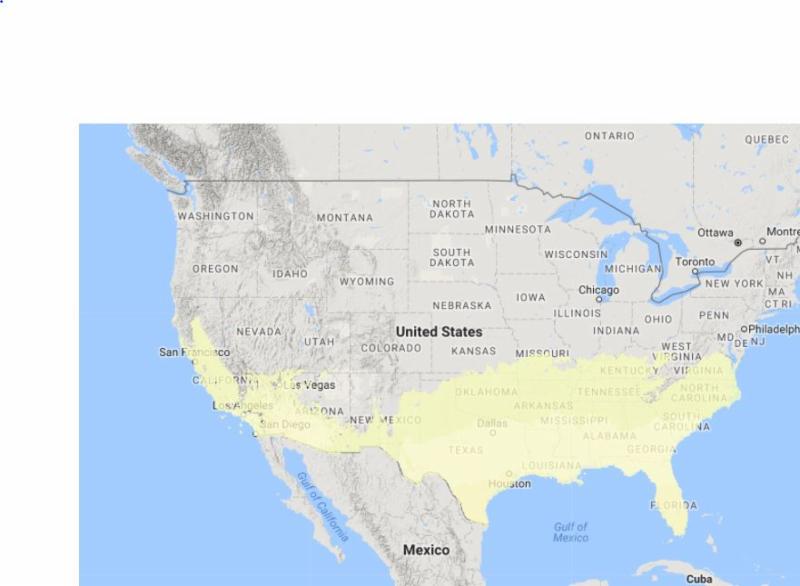
Create threshold maps for pests and invasives
Within the Phenology Visualization Tool, you can also now create customized threshold maps showing where a given AGDD value or AGDD range has been reached on a given day, or create a map showing a range of locations that the Spring Indices have been reached on a given day or range of days of year. This facilitates many applications for decision makers. For example, a land manager can use these maps to determine where and when to treat for insect pests or invasive species.
|
|
|
|
Photo: Tom Grey |
Linking bird migration and the Spring Index
The authors of a study in Ecosphere used data from two continental-scale observation networks to explore the relationship between migratory birds and environmental cues - observations of migratory birds submitted to eBird and weather surveillance radar, which can detect large groups of migrating birds. They compared the observation data to measurements of vegetation green-up collected via satellites and the USA-NPN's Spring Leaf Index. The Spring Leaf Index was strongly related to both the estimates of bird species richness from eBird observations and migration intensity collected via weather radar. By better understanding how birds and the habitat on which they rely are responding to climate change, managers will be more equipped to take actions to promote and conserve habitat where it is needed.
|
 |
|
|
|
Photo: Patricia Guertin
|
NPN data predict phenological transitions
Data from the
National Phenology Database
were used in a recent study published in
PLOS ONE
by Crimmins et al. that investigated the extent to which these data can be used to construct simple thermal time threshold models. The authors were able to construct 107 models for different species-phenophase combinations, showing that there is great potential to develop enhanced predictive models of phenophase transitions using in-situ
data curated by the USA-NPN.
Learn more »
|
Fall Certification Course starts next week
Education Coordinator LoriAnne Barnett is gearing up for another round of our online Local Phenology Leader Certification Course! We will have 18 new students in the course this fall, including four FWS staff from Refuges and Hatcheries across the country. Are you interested in the LPL Certification Course?
Add your name
to the list of interested potential participants for the next round of the course which will begin in January of 2018.
Learn more »
|
USA-NPN recognized for Spring Index maps
|
Phenology monitoring training at NCTC
workshop and training course,
you are welcome to pick the one that
best suits your schedule!
|
|
|
|
|